Setting up system monitoring with a Step agent
This article demonstrates how to set up distributed system monitoring using Keyword executions, and analyze the results as measurements.
This tutorial will demonstrate how to set up distributed system monitoring by leveraging Keyword executions on dedicated token pools, as well as how to analyze the results as numerical measurement in RTM views. This example is based on Windows performance counters using the standard typeperf command. The same approach can be used on Unix with vmstat and can easily be extended and customized to suit other platform needs.
Keyword setup
We will leverage the agent platform and execute a special Keywords at regular intervals in order to poll system metric values and feed them back to Step’s measurement database. Sample Keyword code is provided in our GitHub sample repository under “keywords/java/demo-system-monitoring”. The code contains a generic Keyword for executing managed processes from Java that is extended to cover the Windows typeperf process.
Setup your agent
We will create dedicated execution slots, called token pools, in order to isolate the execution of this technical Keyword from business keywords. You will need to modify the AgentConf.json configuration file in your existing agent setup.
- Add an AGENT_TYPE “DEFAULT” to the main tokenGroups
- Create a 2nd group with a unique AGENT_TYPE name and a capacity of 1
For the controller and database servers, you will install a dedicated agent with only one token group for the monitoring following the same rules, capacity of 1 and unique AGENT_TYPE value.
Example:
{
"gridHost":"http://controller:8081",
"agentPort": 31001,
"registrationPeriod":1000,
"gridReadTimeout":20000,
"workingDir":"../work",
"tokenGroups":[
{"capacity":250,
"tokenConf":{
"attributes":{"AGENT_TYPE" : "DEFAULT"},
"properties":{"chromedriver":"../ext/bin/chromedriver/chromedriver.exe"}}
},
{"capacity":1,
"tokenConf":{
"attributes":{"AGENT_TYPE" : "MONITORING_agentName_001"},
"properties":{"chromedriver":"../ext/bin/chromedriver/chromedriver.exe"}}
}
],
"properties":{
"plugins.jmeter.home":"../ext/lib/jmeter",
"plugins.selenium.libs.2.x":"../ext/lib/selenium/selenium-2.53.1",
"plugins.selenium.libs.3.x":"../ext/lib/selenium/selenium-java-3.5.3",
"plugins.qftest.home":"C:/Users/jcomte/Programs/qftest-4.1.2",
"plugins.pdftest.gsexe":"/path/to/gswin64.exe"
}
}
Step controller parameters
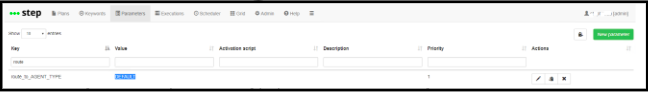
Now that a distinct pool is available for monitoring purposes, we will tell Step to route all regular Keywords to the default pool. Later on, we will make sure to route the monitoring Keywords to the other pool in our plan.
Key: rout_to_AGENT_TYPE, value: DEFAULT
Metric configuration and postprocessing
We recommend updating the typeperf counters already defined in the included resource CSV file, “typePerf.csv”
Metric_name,Typeperf_counter,groovy
CPU(%),\Processor(_Total)\% Idle Time,100-value
MemoryAvailableMB,\Memory\Available MBytes,
- Metric name is the name of the metric which will be reported in RTM
- Typeperf_counter is the typeperf counter to be retrieved. Refer to windows-commands/typeperf to learn more about typeperf.
- groovy is a groovy expression which will be evaluated during the post processing; the resulting value will be stored as the measurement’s value.
The Step plan
The plan in the example below is designed to run for one hour, taking a sample for each defined agent each minute.

Note, the Keyword execution is configured to take place on the new token pool reserved for monitoring. Refer to the routing section of the Keyword call node in the provided plan.
Execution
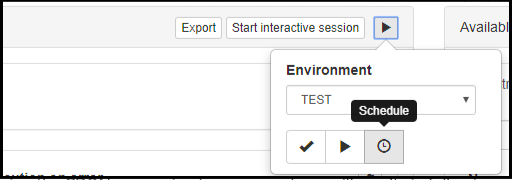
You have the option to run the plan once and tweak it to match your desired duration and sampling interval or to schedule it to restart every hour as shown below:
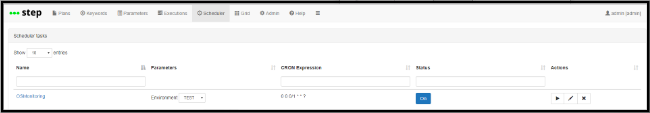
Selecting the CRON expression to run every hour will result in the following entry in the scheduler
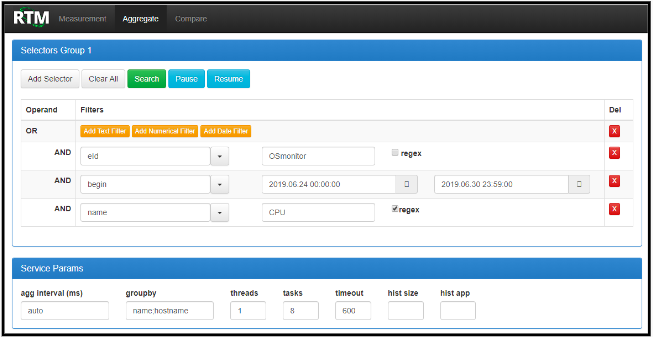
RTM
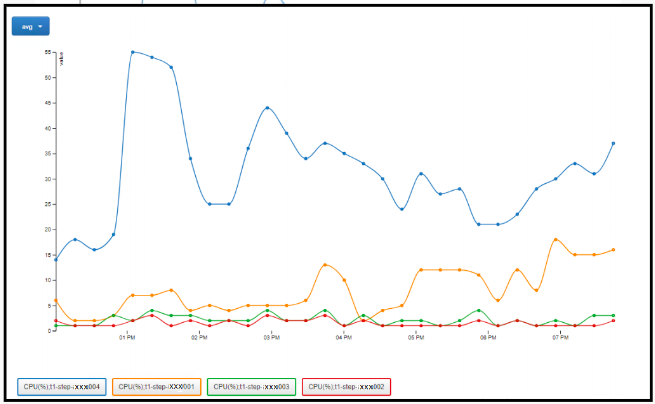
Unlike other test executions, all measurements from this Keyword are created using a common execution id, eld, unrelated to the actual Step execution. The common eld used is “OSmonitor” and is used in RTM to retrieve related measurements. If you keep the monitoring running in the background, it is recommended to use a time frame filter in your query. In addition to the metric name, the “hostname” of the monitoring agent is automatically added to your measurements and you may then use it as a group clause:
Which results in the following output:
Housekeeping
You may cleanup the measurement collection based on the OSmonitor eld and timestamp. Refer to our Housekeeping section.
Summary: This article demonstrates how to set up distributed system monitoring using Keyword executions, as well as how to analyze the results as numerical measurements in RTM views.

This article demonstrates how to connect Grafana to data generated by Step.
This tutorial demonstrates how to automate interaction with Microsoft Office applications using the Office Interop Assembly.

This article provides documentation for how to integrate JUnit tests into Step.
This tutorial demonstrates how Step can be used to monitor services, availability and performance metrics.

This tutorial demonstrates how to utilize the AutoIt C# binding to automate interactions with Windows applications.

This article demonstrates the automation of mobile applications on Android using the Appium framework.
This article defines three Keywords which will be used in browser-based automation scenarios, using Step and Selenium, as general drivers.

This tutorial shows you how to efficiently set up a browser-based load test using existing Cypress tests in the Step automation platform.
In this short tutorial, we show how to quickly implement a simple browser-based load test based on Cypress scripts in Step.

This tutorial shows you how to efficiently set up a browser-based load test using existing Playwright tests in the Step automation platform.

This article explains Keywords in Step and demonstrates how to create simple ones.

This tutorial demonstrates the design, execution, and analysis of functional tests using the web interface of Step.

This tutorial will demonstrate how to use Step and Selenium to automate various browser tasks.
This tutorial demonstrates how to use Step and Cypress to automate various browser tasks.

This tutorial demonstrates how Selenium automation tests can be turned into full synthetic monitoring using Step.
In this tutorial, we'll show you how to easily set up and run a browser-based load test with Step's wizard, using your existing Cypress tests, on the Step automation platform.

This tutorial shows you how to efficiently set up a browser-based load test using existing Selenium tests in the Step automation platform.

This tutorial demonstrates how Playwright automation tests can be turned into full synthetic monitoring using Step.

This tutorial demonstrates how Cypress automation tests can be turned into full synthetic monitoring using Step.

This tutorial will demonstrate how to use Step and Playwright to automate various browser tasks.
In this tutorial, we'll show you how to easily set up and run a browser-based load test with Step's wizard, using your existing Playwright tests, on the Step automation platform.
Quickly integrate K6 based load-tests in your DevOps workflow
This tutorial demonstrates how Playwright tests can be reused for synthetic monitoring of a productive environment in a DevOps workflow
This tutorial demonstrates how Playwright tests can be reused for synthetic monitoring of a productive environment in a DevOps workflow
In this tutorial you'll learn how to quickly set up a protocol-based load test with okhttp

Learn how to set up continuous end-to-end testing across several applications based on Playwright tests in your DevOps pipeline using Step
Learn how to quickly set up continuous browser-based load testing using Playwright tests in your DevOps pipeline
Want to hear our latest updates about automation?
Don't miss out on our regular blog posts - Subscribe now!
