Executions
An execution represent the result of a specific run of a Plan, containing all the information (output values, status, …) about the keywords and controls of this run.
Executing a Plan
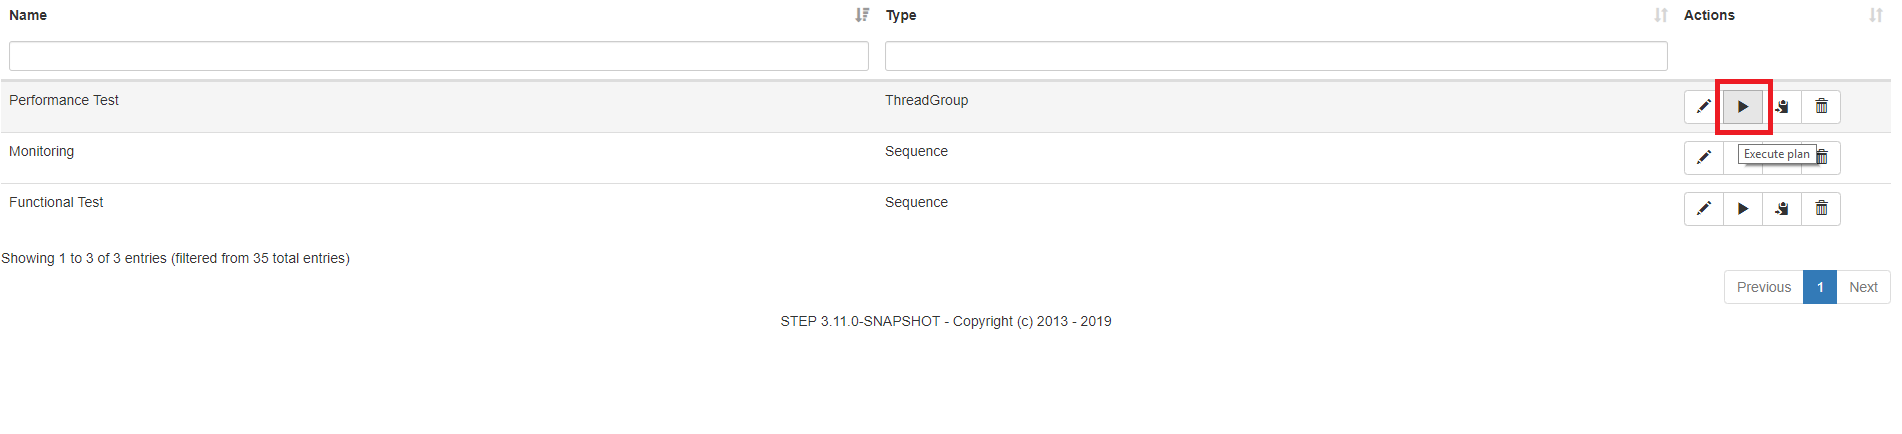
You can run a plan, and create a new corresponding execution by click on the “play” button, available in the Plan list, Keywords list and the Plan editor:
This will display the following generic popup, specifying the execution parameters (in green) and the execution mode
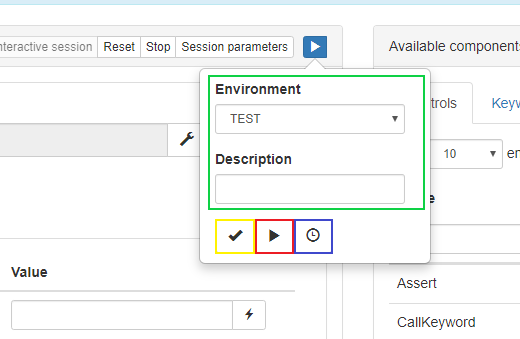
The following execution mode are possible:
- The Simulate execution mode (in yellow in the screenshot). When choosing this mode, only the Plan logic will be validated and the keywords will not be executed
- The Execution mode (in red), running the Plan and the keywords
- The Schedule mode (in blue), allowing to schedule repetitive executions of the plan (see below for more detail)
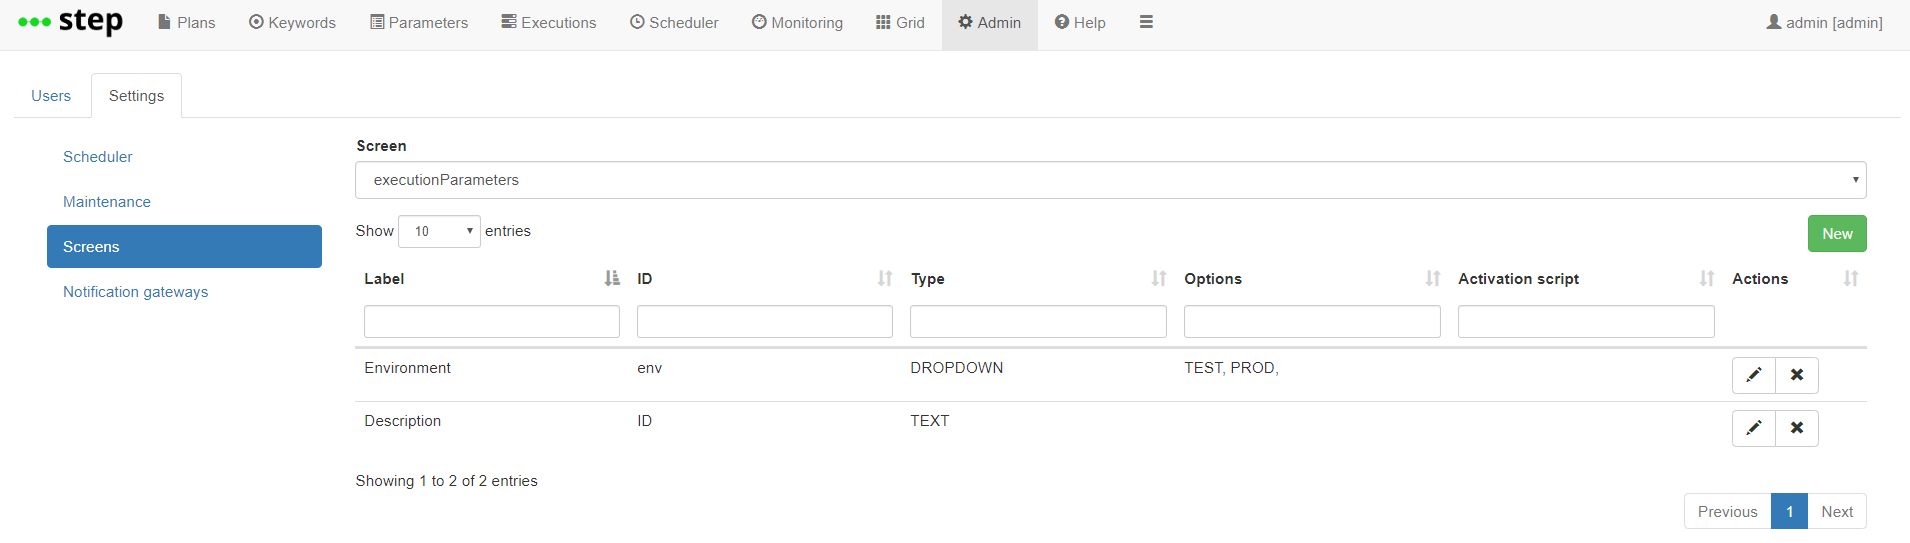
The execution parameters can be defined in the Admin tab, under the Settings:
Executions list
Under the Executions tab, you can view the whole list of your test plans executions.
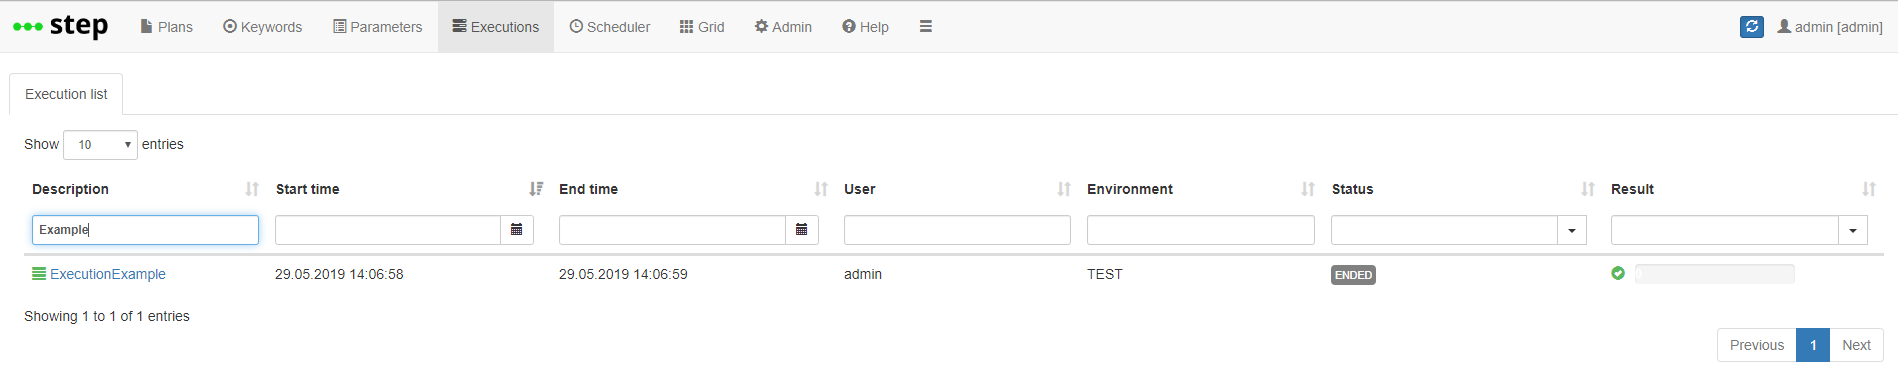
You can filter the executions table using any of the header fields available :
- Description : usually the test plan name you executed
- Start time : the beginning of the execution
- End time : the end of the execution
- User : the user who executed the test plan
- Environment : the target environment
- Status : the current execution status
- INITIALIZING
- IMPORTING
- RUNNING
- ABORTING
- EXPORTING
- ENDED
- Result : the execution end result
- TECHNICAL_ERROR
- FAILED
- PASSED
- INTERRUPTED
- SKIPPED
- NORUN
- RUNNING
Reporting
From the execution table view, clicking on an execution will redirect you to the execution details, which are composed of the below views.
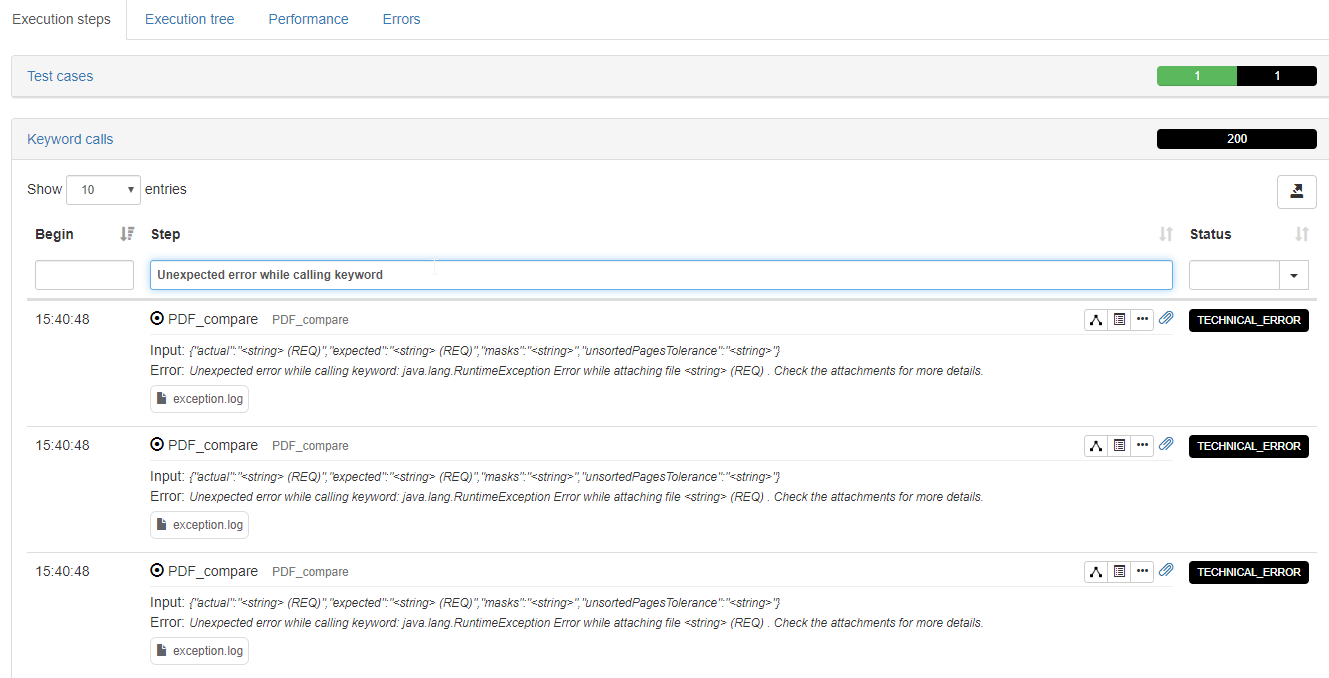
Execution steps
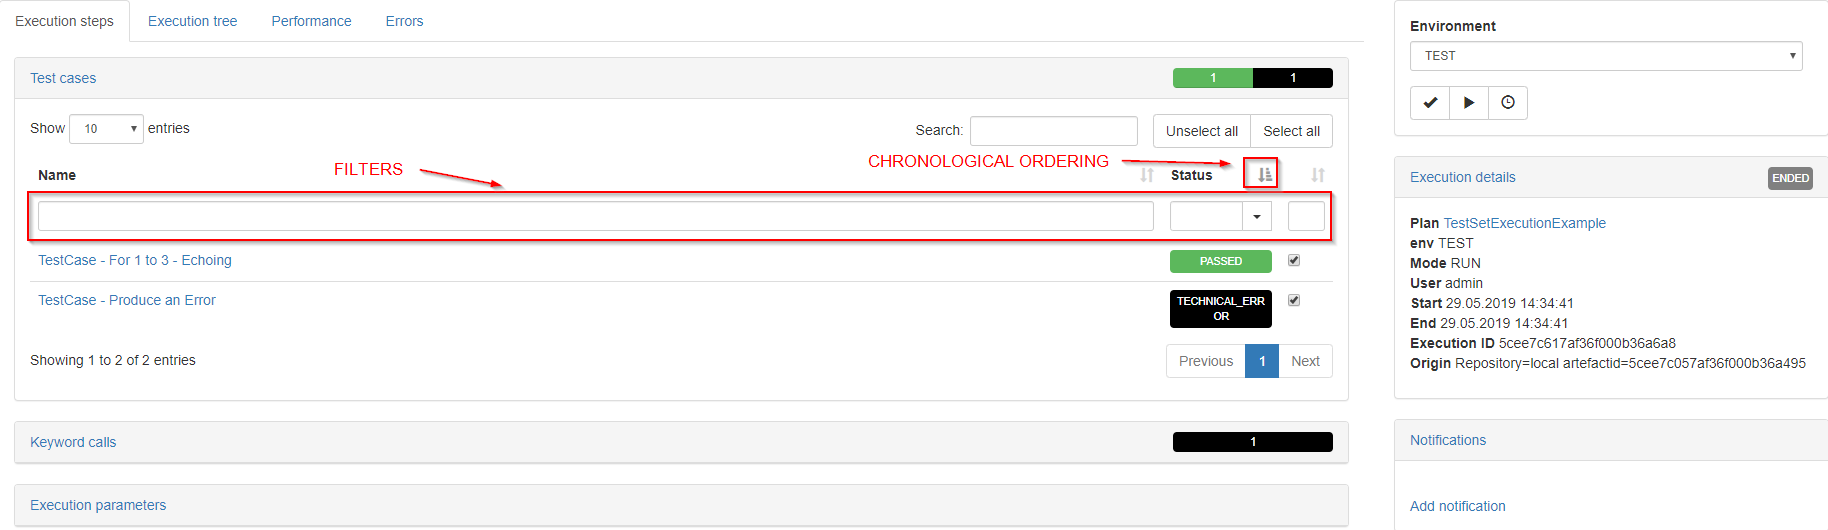
This table display the test plan execution steps in details, by default in reverse chronological order (last executed step first).
Again, you can use the table headers to filter the execution steps table and as well change the chronological display order :
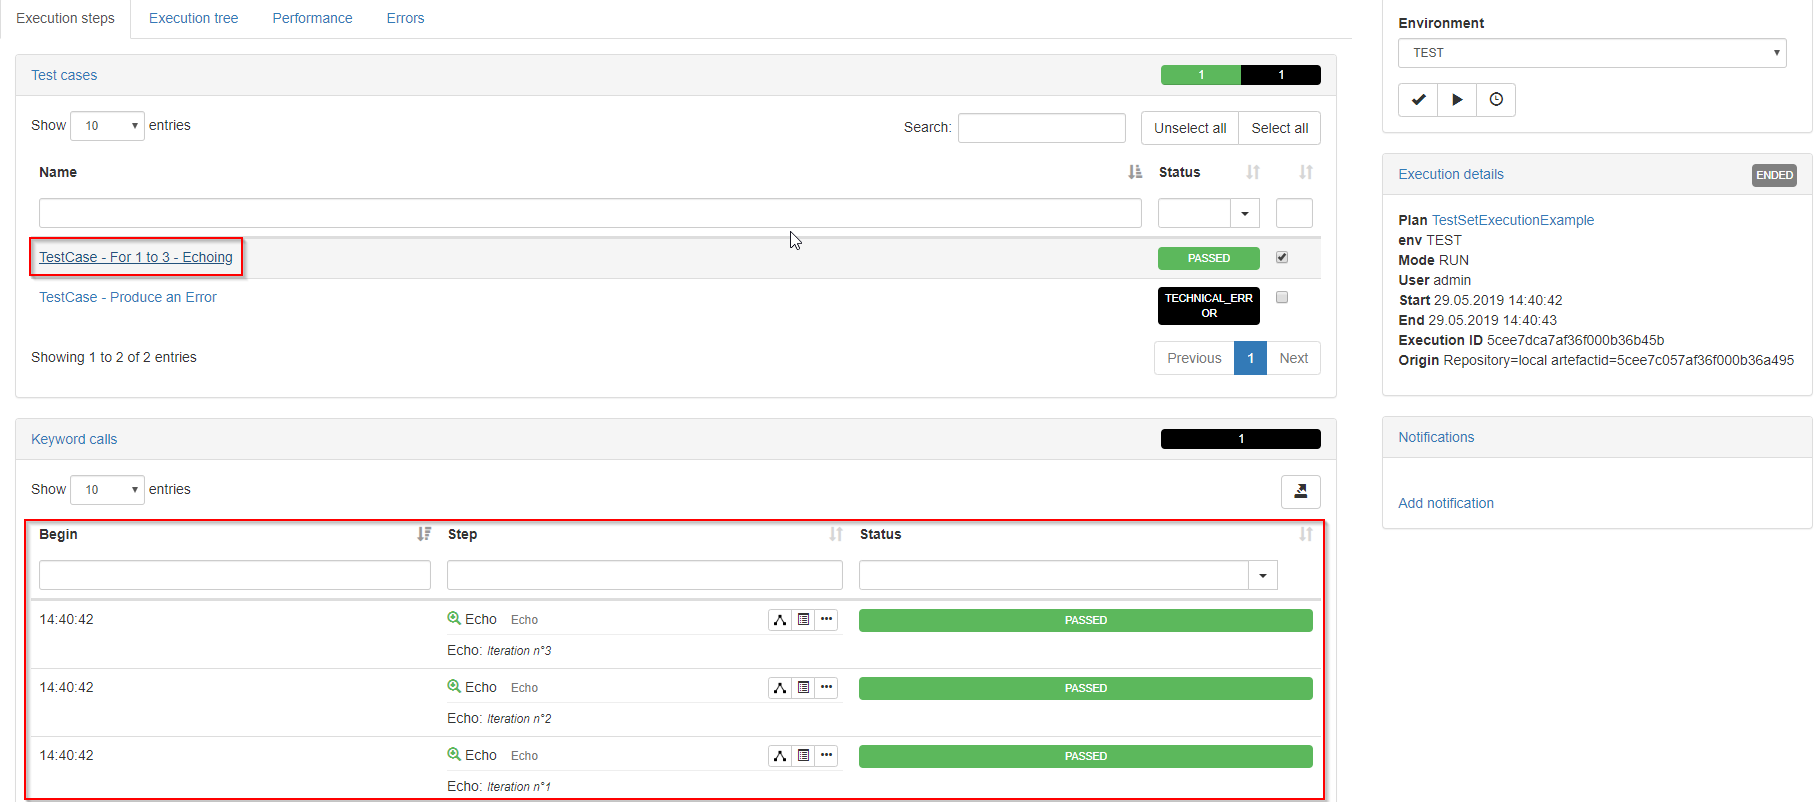
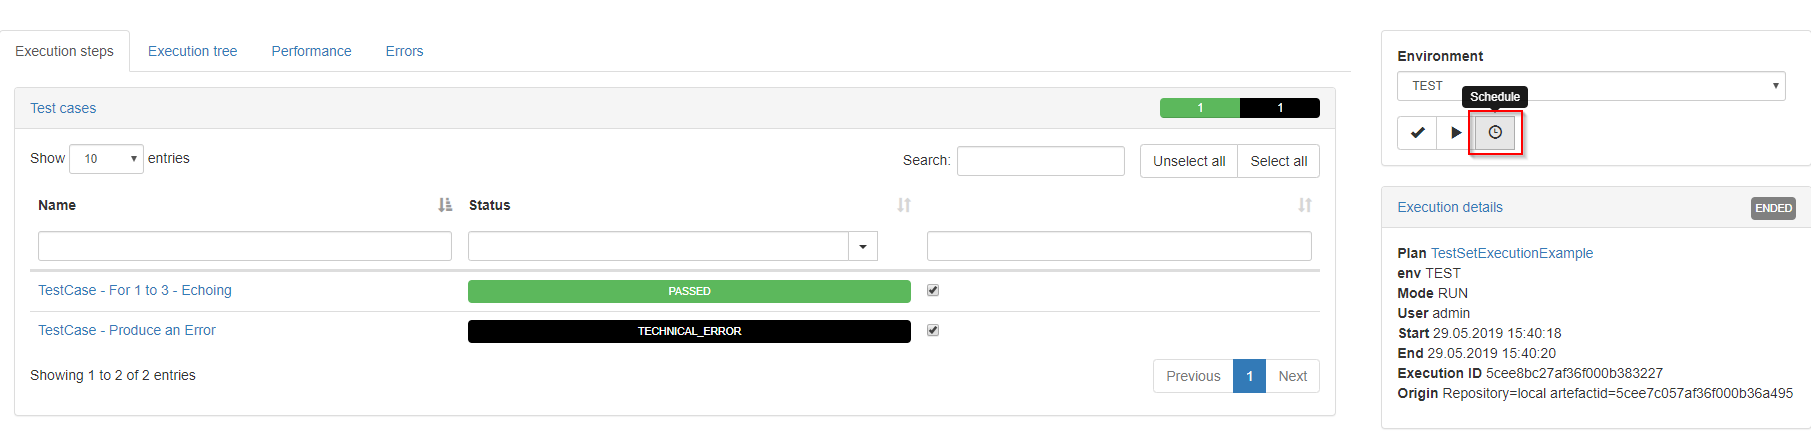
If you are using TestSet and TestCase object like the above example, you can see that the execution steps are grouped by test case : you can open a test case details by clicking on it :
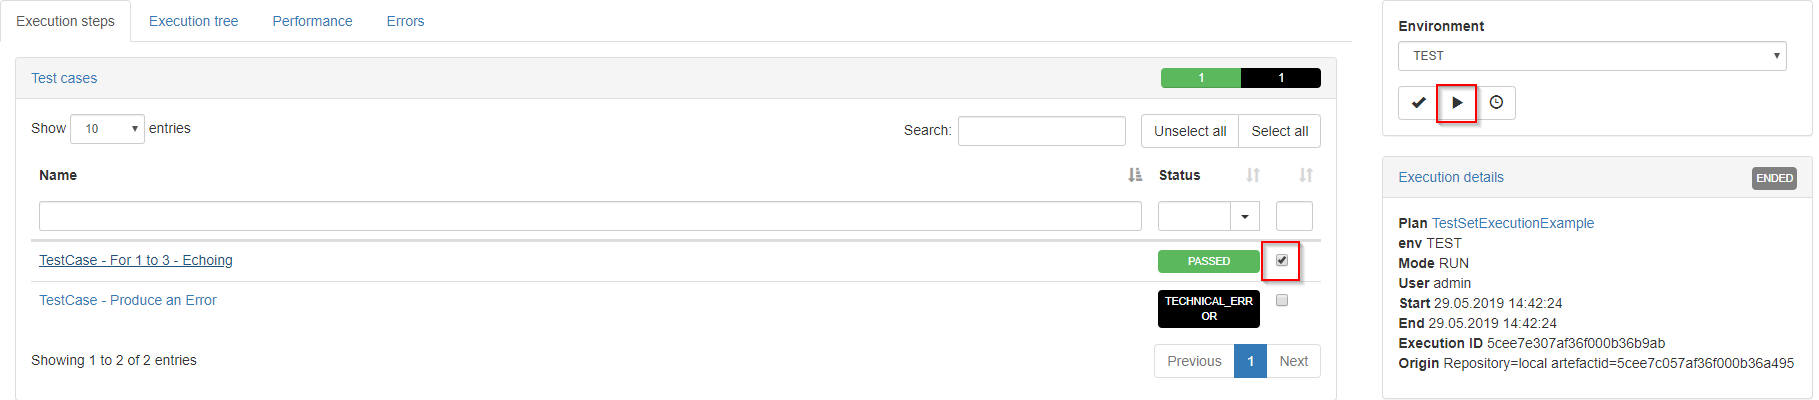
In addition, you can re-execute only selected test cases instead of the whole test plan by ticking its checkbox and click on the execute button :
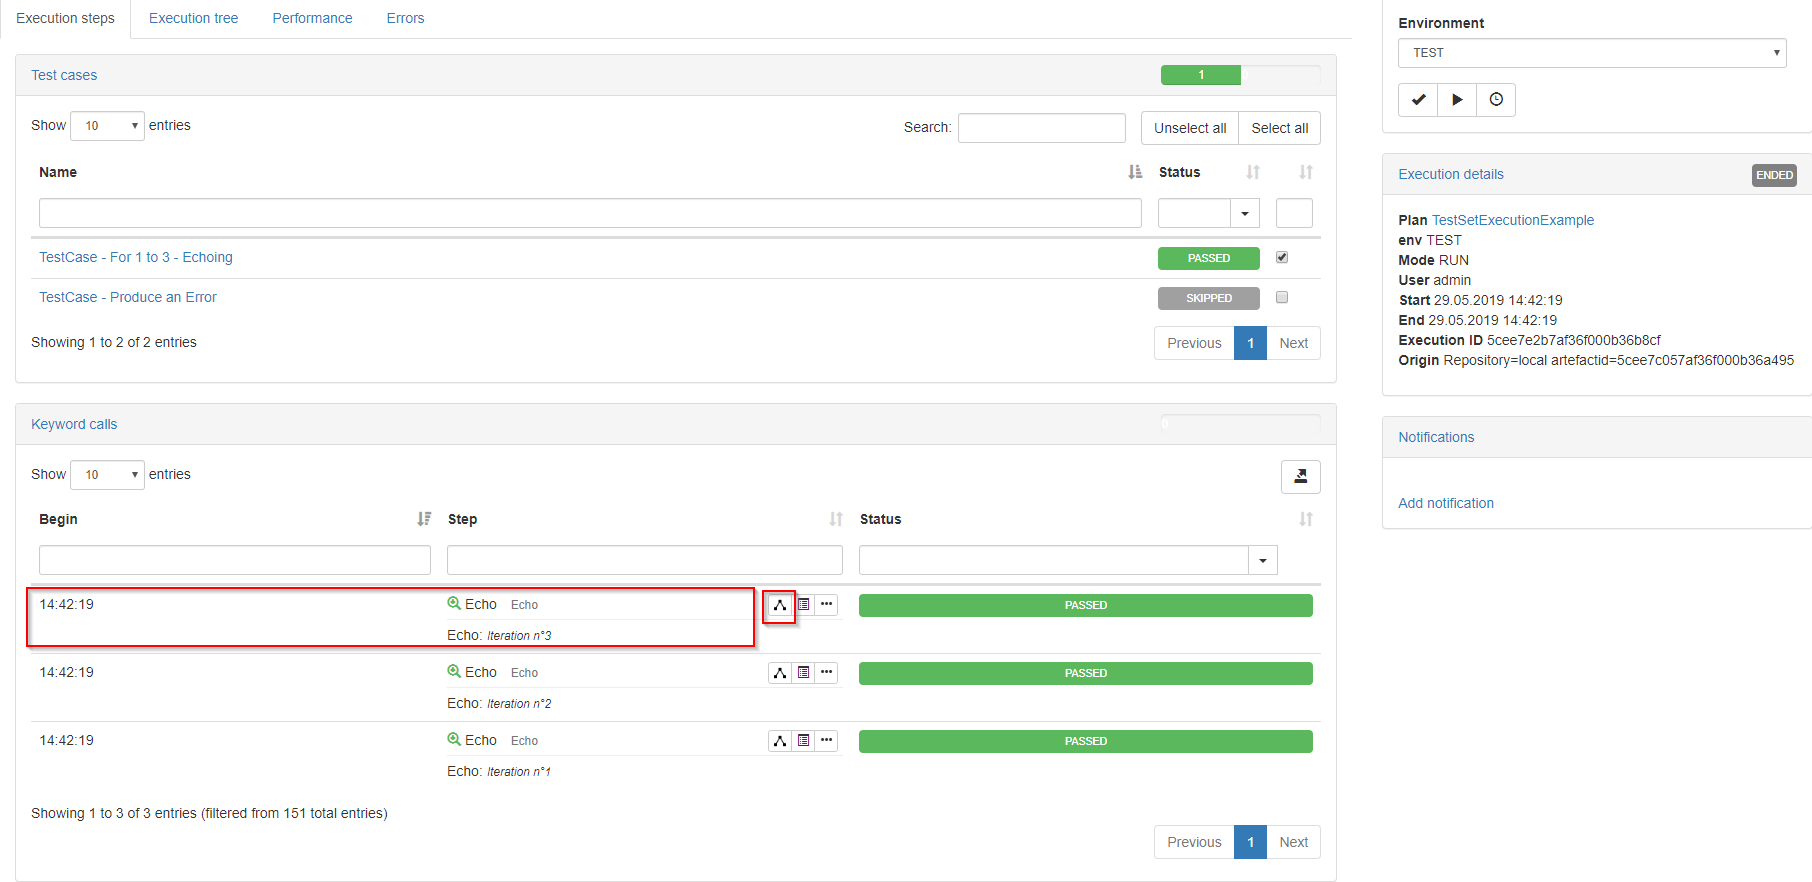
Finally, you can open directly an execution step in the Execution tree (see below) by clicking on its associated button :
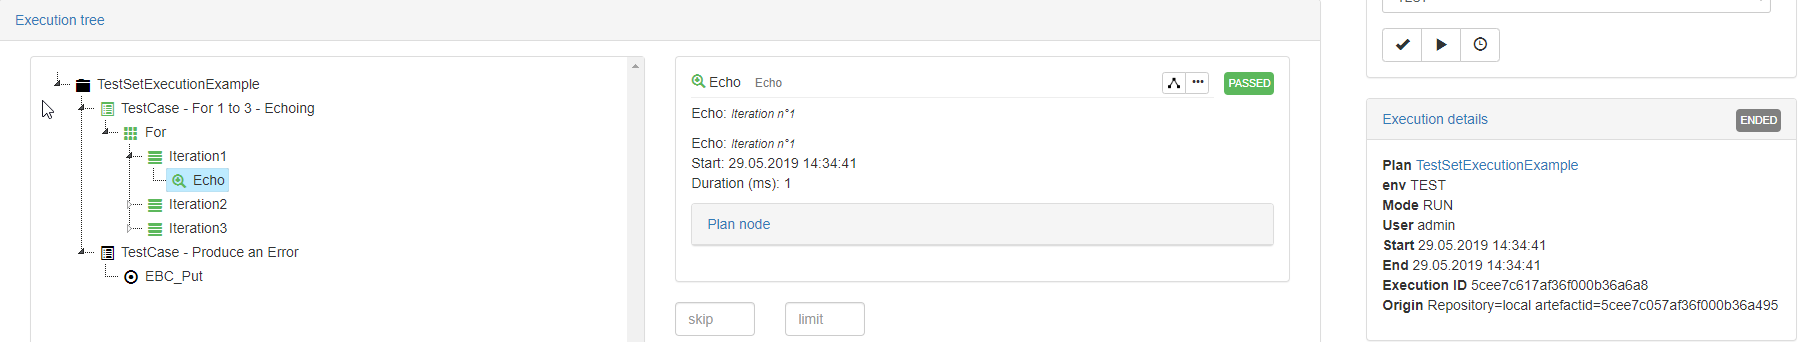
Execution tree
The table display your test plan execution steps as a tree in chronological order. Any node can be expanded to display its content :
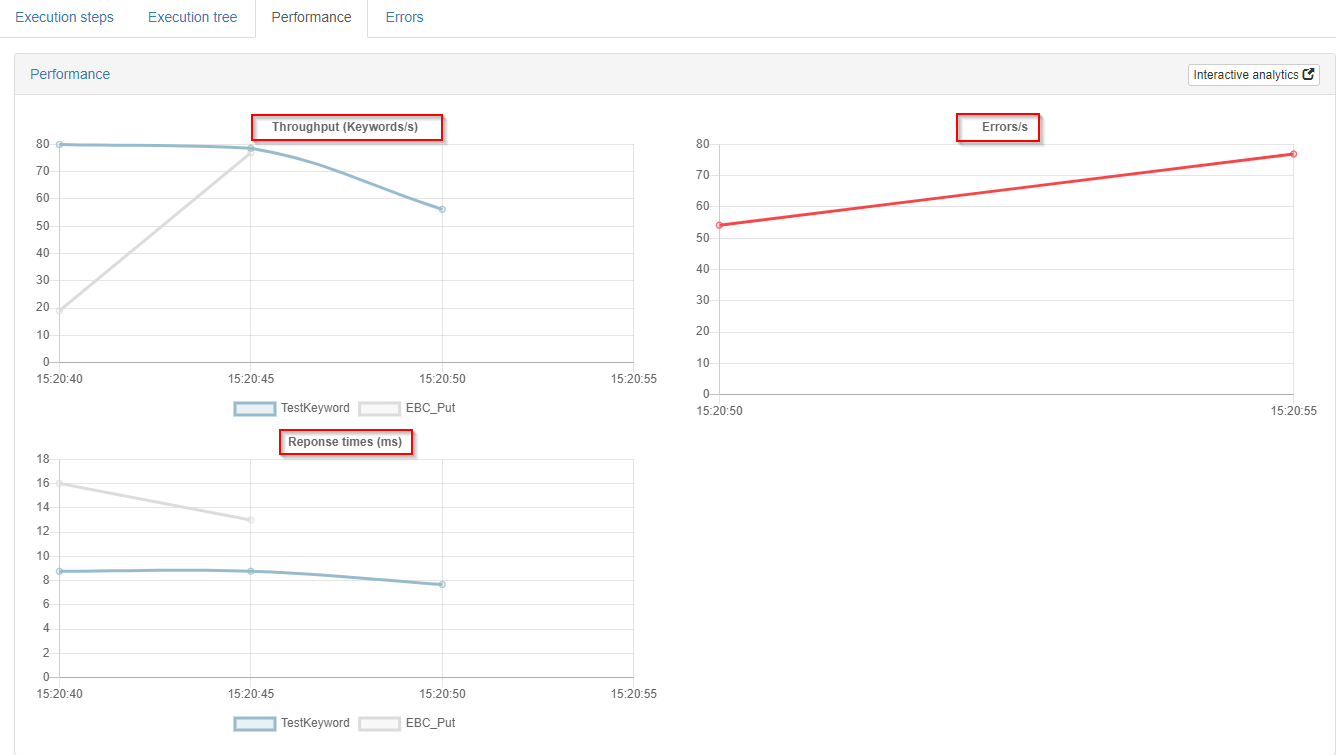
Performance
The performance view display a small overview of the keyword throughput (number of keyword execution per second) and error rate, as well as the average response time of the executed keywords :
In addition, some more detailed performance metrics can be retrieved using RTM (Response Time Manager) by clicking on the “Interactive analysis” link :
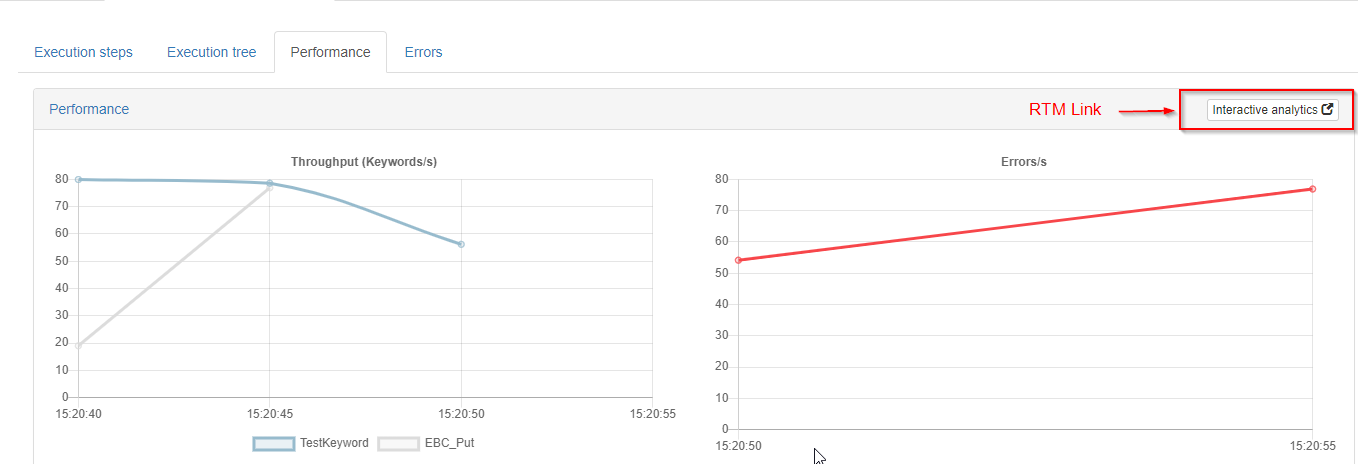
Documentation about RTM can be found here.
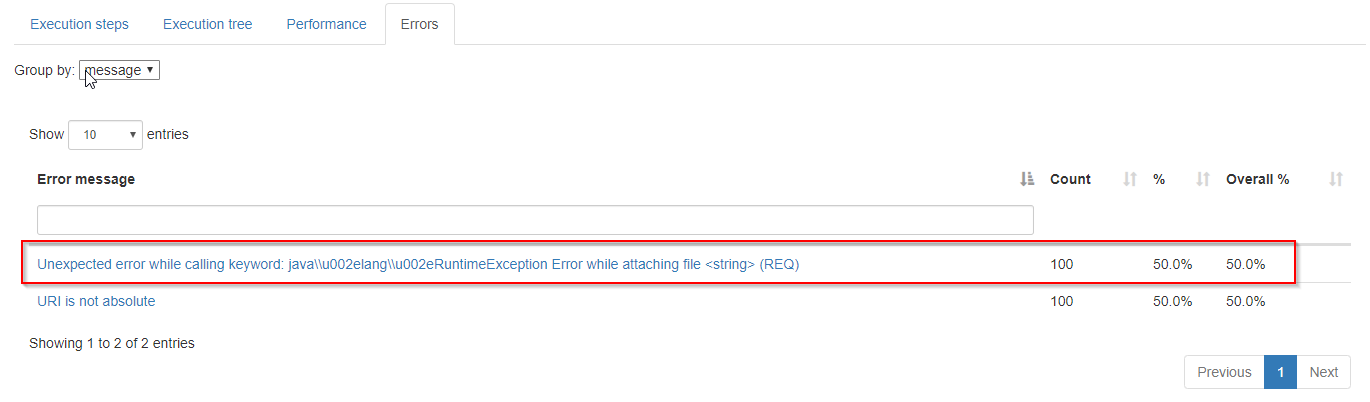
Error
The error view display an overview of the errors (grouped by error type) which occurred during the execution :
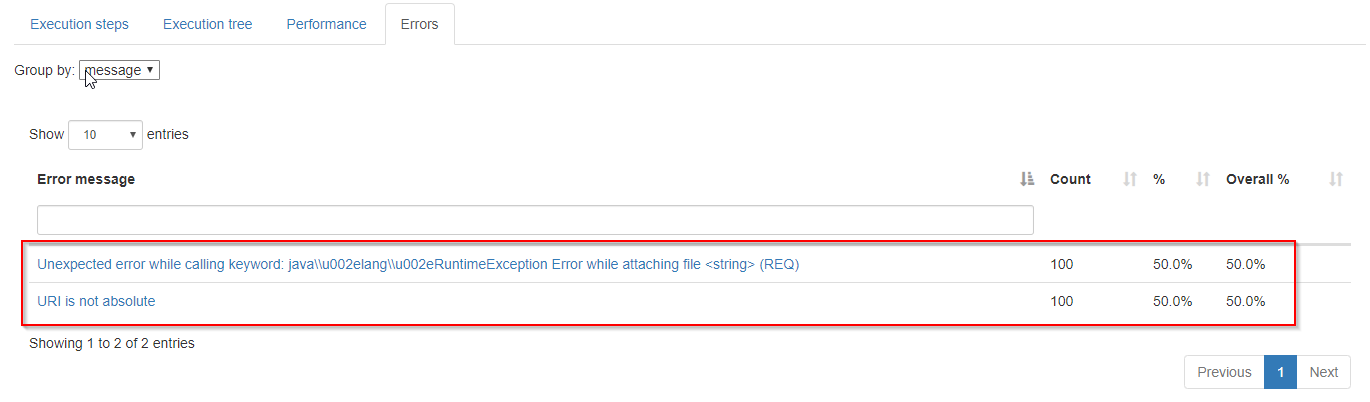
You can jump directly to the nodes producing the error by click on the error type :
Scheduling
step offers you the possibility to schedule executions of Test Plans based on JAVA CRON expressions. From the executions view ,click on the “Schedule” button on the top right :
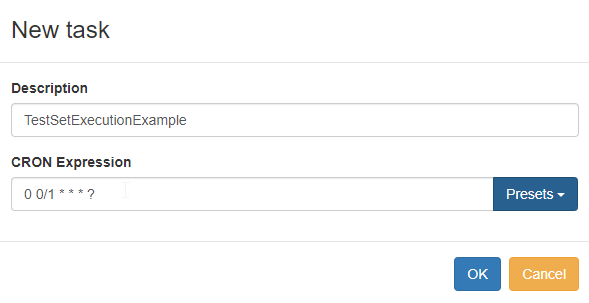
Enter the CRON expression which will define when the plan will be executed then press the “OK” button:
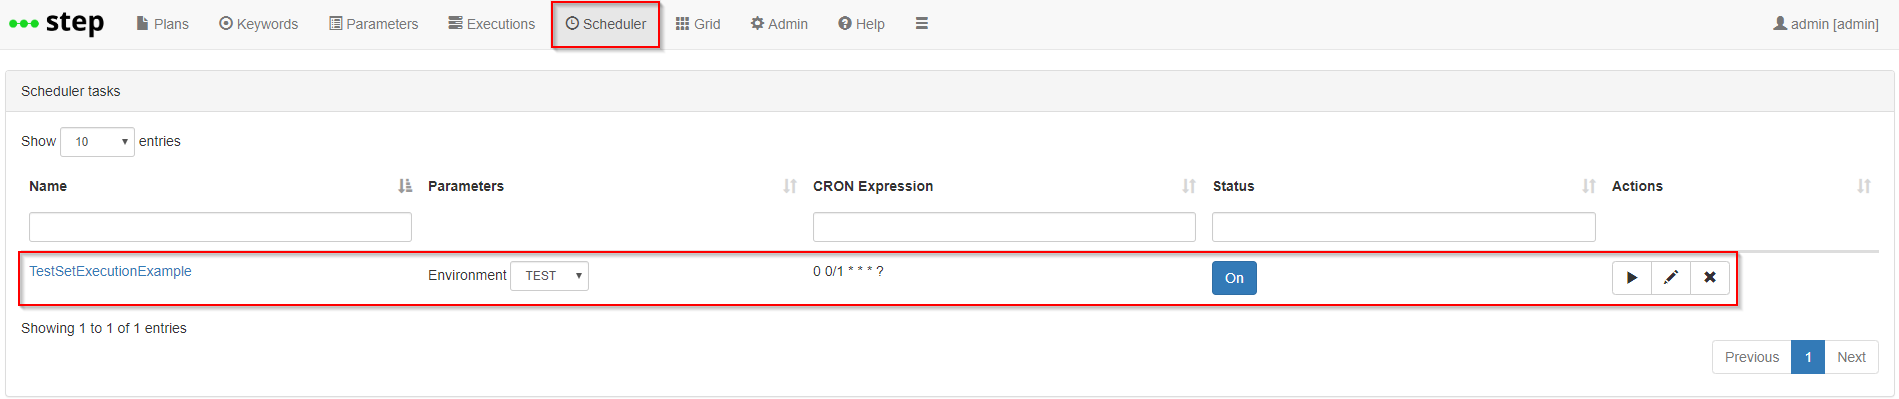
You can then switch to the “Scheduler” tab in order to view, edit and control the scheduling entries you set up :
Here are some basics examples of CRON expressions. If you are not familiar with, we encourage you to take a look at the CRON official documentation.
| Expression | Means |
|---|---|
| 0 0 12 * * ? | Fire at 12:00 PM (noon) every day |
| 0 15 10 * * ? | Fire at 10:15 AM every day |
| 0 * 14 * * ? | Fire every minute starting at 2:00 PM and ending at 2:59 PM, every day |
| 0 0/5 14 * * ? | Fire every 5 minutes starting at 2:00 PM and ending at 2:55 PM, every day |