How to monitor services availability and performance
This tutorial demonstrates how Step can be used to monitor services, availability and performance metrics.
This tutorial will demonstrate how Step can be used to monitor services availability and metrics. We will utilize plan executions in combination with the notification package, the scheduler, and the monitoring view as a dashboard.
Prerequisites
- Understanding of Step Keywords and Plans.
- Understanding of how monitoring plans are defined. You can refer to the example of test sets and test cases.
Services availability and performance monitoring
Keywords definition
Assume you are operating 3 different Windows services and you want to monitor them by checking their status, running or dead, and measure the average response time needed to execute the check.
A simple Keyword will be used to check these services and return the output of the service’s health status, running or stopped. The Keyword has 2 inputs:
- executablePath: In this tutorial we are using PowerShell.
- serviceDisplayName: The service name as displayed in the Windows Service Control Manager.
You can find a sample of the Keyword code to be used (Windows OS) in the Step sample project hosted on GitHub.
To register the sample Keyword(s), WindowsServiceStatusKeyword into Step follow the instructions below:
- Checkout the Step samples project using your favorite SCM tool.
- Execute a Maven build using the “package” goal on the project demo-system-monitoring to produce the Keywords jar.
- Register the WindowsServiceStatusKeyword Keyword into Step as described here.
Define your monitoring plans
Setup your keywords and TestCases
For clarity purposes, the Keyword calls have been labeled with the service name as below:
- Check_DHCP_Client_Service_Health
- Check_DNS_Client_Service_Health
- Check_Print_Spooler_Service_Health
Let’s define a simple plan of type TestSet containing 3 TestCase controls to execute the services health check Keywords:
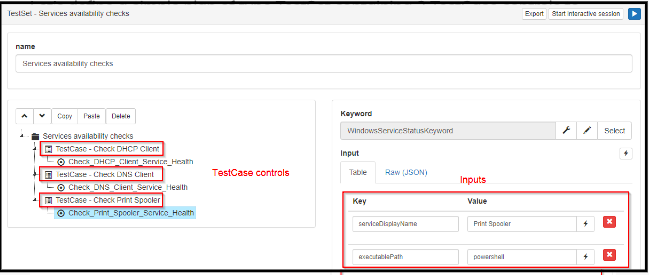
A good practice is to wrap each of your checks in a TestCase control. This enables an execution per test case split view and allows for better control on what is executed in the monitoring checks test set.
In addition, all of your test cases that are defined under a TestSet control will be executed in parallel.
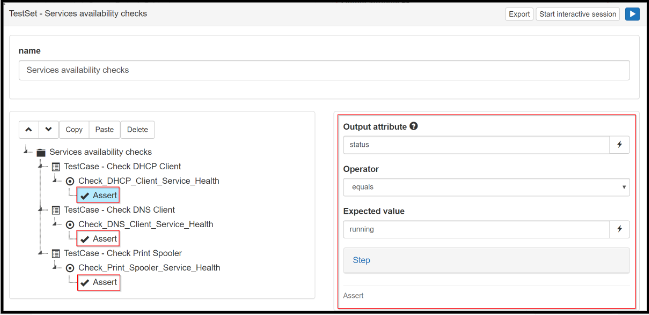
Add an assertion on keyword output
In order to perform a check on the service status, running or not, within our test plan we will add an Assert control under each of our Keywords:
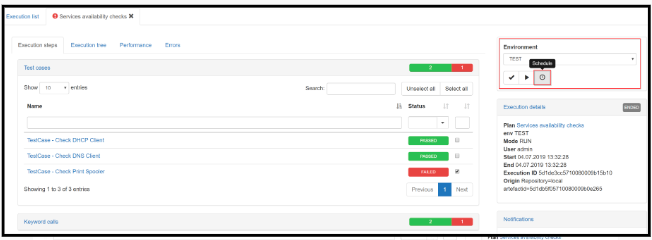
Let’s execute the plan and click on the Check Sprint Pooler test case to display its content:
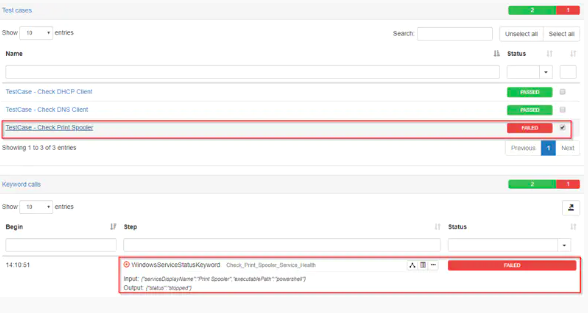
In the screenshot above, we can see that the Check Print Spooler Keyword node status is red and marked as “FAILED” because the service is stopped. These functional checks can now be productively used in order to monitor our services.
Schedule your plan
Now that we have functional checks, we will schedule them to run periodically using the scheduler.
- From an execution of your plan, click “Schedule” in the top right panel.
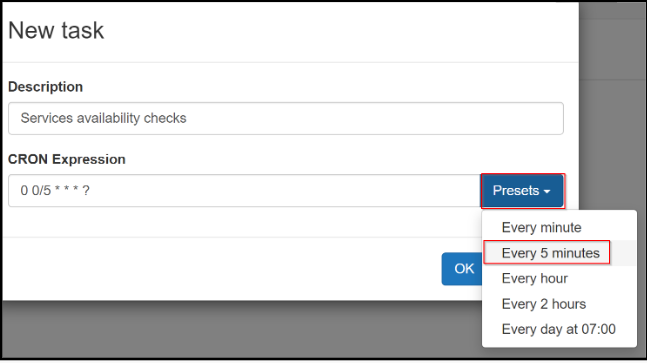
- Now, define the period you want your monitoring plan to be executed in. In this example, we are using the “Every 5 minutes” preset, but you may use the Java CRON expression of your choice.
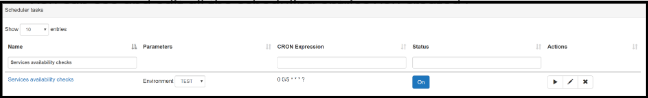
- Click “OK” and you will be redirected to the Step scheduler tab where you will be able to see and edit all the scheduling entries you created.
Add notifications to your plan
Notifications are made available as an Enterprise Plugin.
Step can trigger automatic email notifications based on the overall status of the executed plan to provide you with alerts.
We recommend configuring your email gateway(s) prior to setup of notifications on your plans.
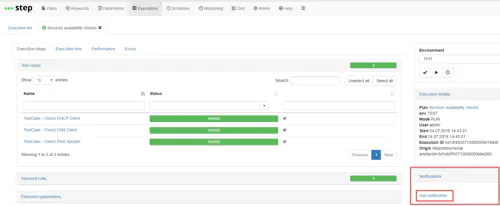
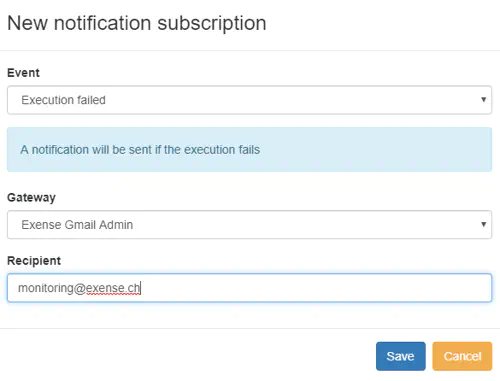
- Open an execution of your monitoring test plan and click the “Add notifications” link in the bottom right panel.
- Choose what kind of event notification should be triggered, execution ended or failed. Fill your notification gateway and the notification recipient.
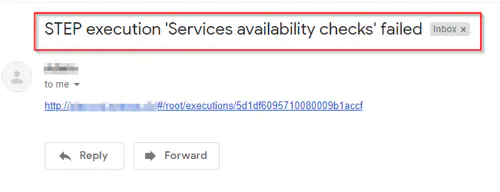
In this example, we chose to receive a notification when the monitoring test fails. We will stop the Print Spooler service on our monitored instance and wait for the next execution. Five minutes later, the following email has delivered to our mailbox:
Consult your monitoring dashboard
Monitoring dashboards are made available as Step’s Enterprise Versions.
You can access the monitoring dashboard by clicking on the “Monitoring” tab in the top menu:
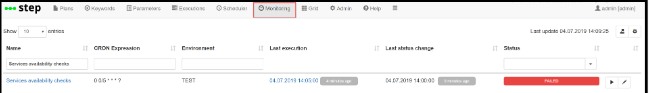
You can see that the latest execution of our monitoring plan ended as “FAILED” because the Print Spooler service is not running.
In order to illustrate the “Last status change” column behavior, we will fix the Print Spooler service and wait for the next plan execution. Below is the monitoring view five minutes after having fixed the service:
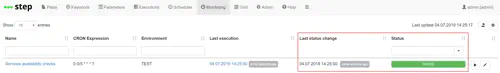
The “Last status change” column value has been updated according to the last plan execution’s overall status.
Long term trends/history
In order to display the performance metrics over a period of time, follow these steps:
- Switch to the “Performance” tab and click on “Interactive analytics:
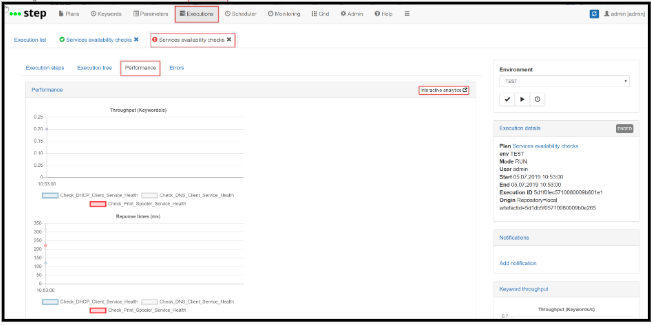
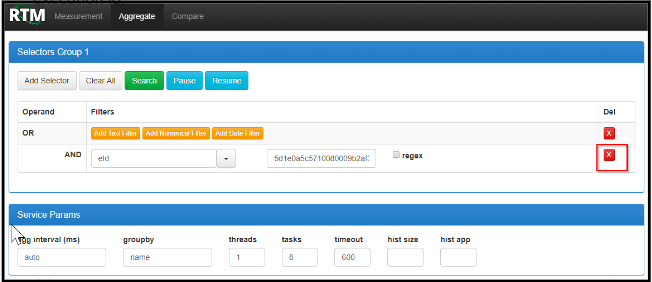
- Now that you have been redirected to RTM, remove the existing filter base on the execution ID. The execution ID’s purpose is to filter the measurements of the selected execution. We are interested in all the measurements of a specific plan over time, so you will remove the existing filter base on the execution ID. Click on the associated red x icon to remove it.
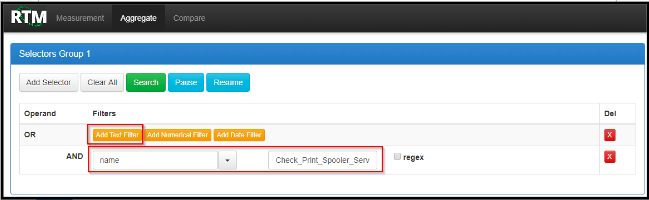
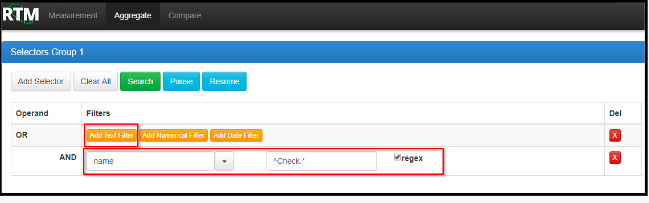
- Filter out the result to display only the Check_Print_Spooler_Service_Health Keyword’s response time.
- Add a simple “Text filter” based on the Keyword name
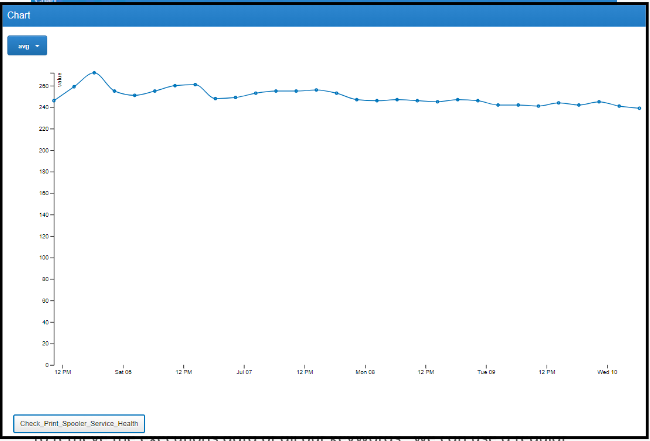
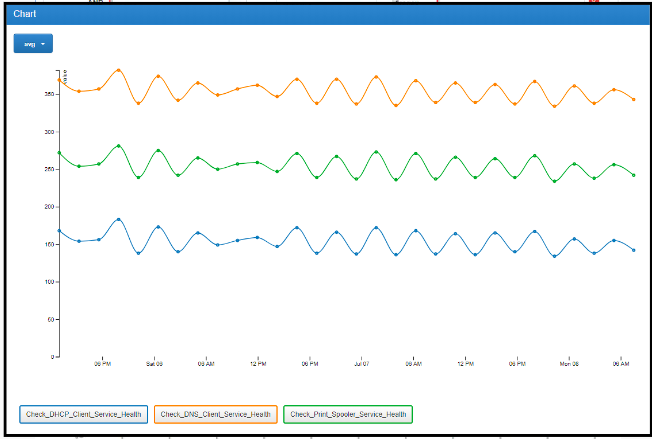
View the graph containing the average response time for the selected keyword below.
You can use a regular expression filter based on the keyword name to retrieve the executions data of all our Keywords. In the example below, all of the Keyword names start with “Check”:
Now, you can view the graph containing the average response time of each service over time:
Summary: This tutorial demonstrates how Step can be used to monitor services, availability and performance metrics.

This article demonstrates how to connect Grafana to data generated by Step.
This article demonstrates how to set up distributed system monitoring using Keyword executions, and analyze the results as measurements.
This tutorial demonstrates how to automate interaction with Microsoft Office applications using the Office Interop Assembly.

This article provides documentation for how to integrate JUnit tests into Step.

This tutorial demonstrates how to utilize the AutoIt C# binding to automate interactions with Windows applications.

This article demonstrates the automation of mobile applications on Android using the Appium framework.
This article defines three Keywords which will be used in browser-based automation scenarios, using Step and Selenium, as general drivers.

This tutorial shows you how to efficiently set up a browser-based load test using existing Cypress tests in the Step automation platform.

In this short tutorial, we show how to quickly implement a simple browser-based load test based on Cypress scripts in Step.

This tutorial shows you how to efficiently set up a browser-based load test using existing Playwright tests in the Step automation platform.

This article explains Keywords in Step and demonstrates how to create simple ones.

This tutorial demonstrates the design, execution, and analysis of functional tests using the web interface of Step.

This tutorial will demonstrate how to use Step and Selenium to automate various browser tasks.

This tutorial demonstrates how to use Step and Cypress to automate various browser tasks.

This tutorial demonstrates how Selenium automation tests can be turned into full synthetic monitoring using Step.
In this tutorial, we'll show you how to easily set up and run a browser-based load test with Step's wizard, using your existing Cypress tests, on the Step automation platform.

This tutorial shows you how to efficiently set up a browser-based load test using existing Selenium tests in the Step automation platform.

This tutorial demonstrates how Playwright automation tests can be turned into full synthetic monitoring using Step.

This tutorial demonstrates how Cypress automation tests can be turned into full synthetic monitoring using Step.

This tutorial will demonstrate how to use Step and Playwright to automate various browser tasks.
In this tutorial, we'll show you how to easily set up and run a browser-based load test with Step's wizard, using your existing Playwright tests, on the Step automation platform.
Learn how to quickly set up continuous browser-based load testing using Cypress tests in your DevOps pipeline
Quickly integrate K6 based load-tests in your DevOps workflow
This tutorial demonstrates how Playwright tests can be reused for synthetic monitoring of a productive environment in a DevOps workflow
This tutorial demonstrates how Playwright tests can be reused for synthetic monitoring of a productive environment in a DevOps workflow
In this tutorial you'll learn how to quickly set up a protocol-based load test with okhttp

Learn how to set up continuous end-to-end testing across several applications based on Playwright tests in your DevOps pipeline using Step
Learn how to quickly set up continuous browser-based load testing using Playwright tests in your DevOps pipeline
Want to hear our latest updates about automation?
Don't miss out on our regular blog posts - Subscribe now!
