Using Step with Grafana
This article demonstrates how to connect Grafana to data generated by Step.
Intro
This tutorial will walk you through the steps needed to connect Grafana to data generated by Step. By the end of this tutorial, you will have
- Configured Grafana to connect to data generated by Step in a database of your choice
- Imported a performance dashboard
- Visualized Step data in Grafana
Why Grafana
Grafana is a well known open-source dashboarding product with versatile functionality, a broad community, and a vast ecosystem. In addition, it is frequently updated, and devops friendly. It is especially well-suited for analyzing time-series data, such as the data generated by Step. Enabling users to access Step data in Grafana, alongside other metrics, will allow users to generate more value out of their data.
Grafana relies on data source plugins to ingest data from various databases and applications. Although there is no Step data source plugin, Step users can connect Grafana to databases that contain Step measurement data. MongoDB is stored in the open-source Step measurements. Step Enterprise makes it possible to use a plugin to concurrently store measurements in a different database.
The Grafana dashboard is built out of “panels” including built-in panel types shipped with Grafana and a collection of community-developed panel plugins. We have included some of these plugins in Step dashboards for improved usability. However, the most basic version of the dashboard will also work without these plugins.
Grafana and MongoDB
Step writes the measurement data into a MongoDB collection by default. At the moment, Grafana doesn’t ship with a MongoDB data source within the open-source edition. However, there is a community-developed open-source MongoDB plugin available; the plugin relies on a Node.js proxy server that serves the aggregation requests from Grafana UI to the Mongo backend and back. This tutorial requires that the community plugin be installed in order to connect to the Step data stored in MongoDB.
If you have an Enterprise version of Grafana, you may be able to use an official MongoDB data source instead. This requires slight re-working of the aggregation queries as these two data source plugins expect slightly different data formatting such as, renaming some fields in the output of the last aggregation stage.
The dashboards require MongoDB v4.0.x or later.
Step data and other databases
Utilizing the Step Enterprise analytics plugins, the user can enable Step to concurrently write data into databases of choice such as PostgreSQL or Prometheus. PostgreSQL and Prometheus data sources are both available in the open-source edition of Grafana and will work out of the box.
Performance considerations
Grafana is designed to re-run all the active queries of all the open panels every time the dashboard is refreshed, the time range changed, or a different variable is selected. If you have a large number of measurements already present in the database, you may incur performance problems. You may want to try:
- Optimizing indexes in your database, especially for the fields which are declared as dashboard variables, as they are often used in queries (eld, name, status, type).
- Hiding rows with the panels you don’t need within your dashboard - the queries inside the panels in hidden rows are not being fired.
- Using the dashboards provided as a starting point to create your own dashboards - remove panels and variables that you do not use frequently.
- Consider using a different database. TimescaleDB may be significantly faster than MongoDB. Consider using Prometheus as an approximate monitoring solution.
Overview of the essential steps
Follow the steps below to monitor Step data in Grafana.
- Install Grafana according to the official instructions. We recommend version 7.5.6+ (The provided dashboards will be partially working from 7.2+).
- Decide on your data source. If using other databases than MongoDB, enable Step to write data to external databases.
- Configure Grafana.
- If using MongoDB as a data source, install the community plugin
- Install additional panel plugins as described below
- Configure the data source
- Import a Step dashboard
- Run an execution in Step to produce data
- Monitor and analyze your Step data in Grafana.
Install and configure Grafana to read Step data
If you don’t have a running Grafana instance, follow the official documentation to install one. Once Grafana is installed, run the Grafana server and open Grafana in the browser. You will be prompted to login in (admin/admin) and create a new user.
Plugins
Grafana offers an automated way to install plugins using grafana-cli, but in our experience many plugins hosted in the official repository are not up to date with their latest releases. The waiting time for a new release of a plugin to be accepted in the official repository can take months. We recommend using manual installation of the latest release, not yet visible in grafana-cli for trusted plugins. Follow the instructions below
- Go to a relevant git repository
- Download the most recent plugin release
- Unpack the plugin to the plugin directory you have selected in the Grafana configuration. Default is GRAFANA_DIR/data/plugins
- Restart the Grafana server and force refresh the Grafana UI if kept running
Please ensure that using unsigned or manually installed plugins is compliant with the guidelines in your organization.
Plugins relevant for Step dashboards
The MongoDB data source Grafana plugin is relevant for Step dashboards. It can be installed following the step described above.
Configure the data sources
Once you have installed the plugins, connect Grafana to Step data by defining a Grafana data source. If you run your database at a different configuration than the standard one, have this information ready
MongoDB with community plugin
Before the first start:
- Go to the directory where you installed the plugin (e.g. GRAFANA_DIR/data/plugins/MONGO_PLUGIN_DIR)
- Install the Node.js dependencies as described in the plugin documentation
To set up a data source:
- Run the proxy server (npm run server) in the plugin directory. By default it listens to requests from Grafana on http://localhost:3333
- In Grafana:
- Open Configuration → Data Sources:
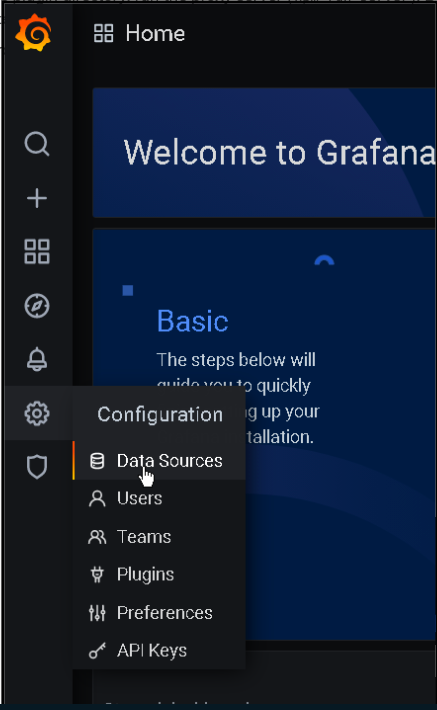
- Select “Add Data Source”

- Select “MongoDB data source”

- You will see the following screen with data resource settings
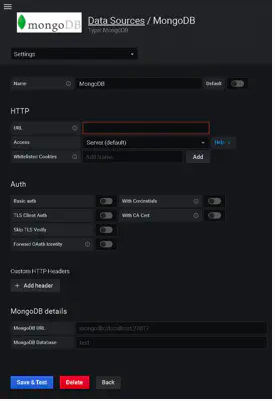
- Fill in the data source settings using the following values
- Name: step-mongo
- URL: PROXY_SERVER_URL (default localhost:3333)
- MongoDB URL: MONGO_DB_URL (default mongodb://localhost:27017)
- MongoDB Database: step
- Configure your authentication details in the Auth section
- Click “Save & Test”. You should see a green message confirming that the connection test was successful.
Data source name (step-mongo) and database name (step) are required for the database to work. Make sure there are no typos.
Congratulations! You have set up a data source that will communicate to the measurement data from Step.
Every time you want to use this data source in a dashboard, the proxy server needs to be running. If you see errors such as “Service Failed Bad Gateway” or “Error updating options: Bad Gateway” in Grafana, it may indicate that the server is not running. Turn it back on and refresh the dashboard.
PostgreSQL/TimescaleDB
Connection to an existing PostgreSQL instance is done using a built-in PostgreSQL data source provided by Grafana.
- In Grafana:
- Open Configuration → Data Sources
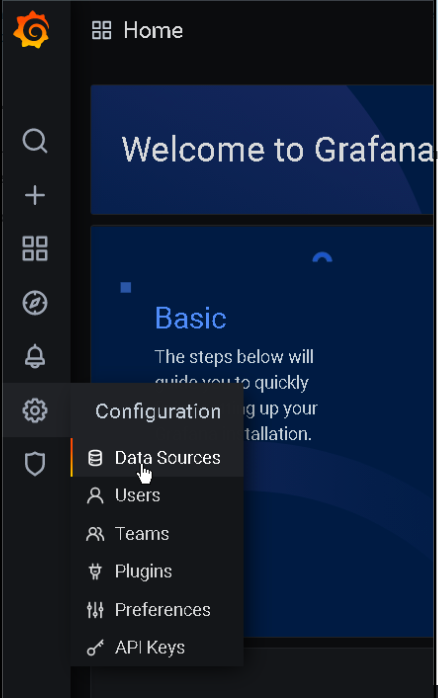
- Select “Add Data Source”

- Select “PostgreSQL data source”
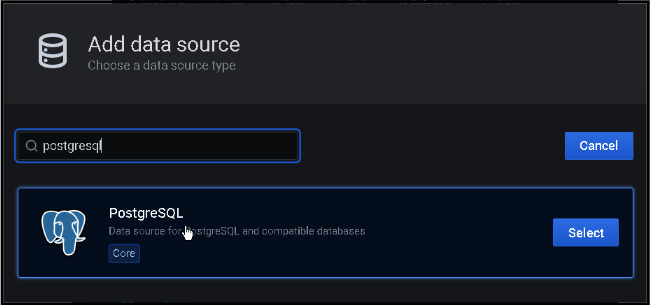
- You will see the screen with data source settings
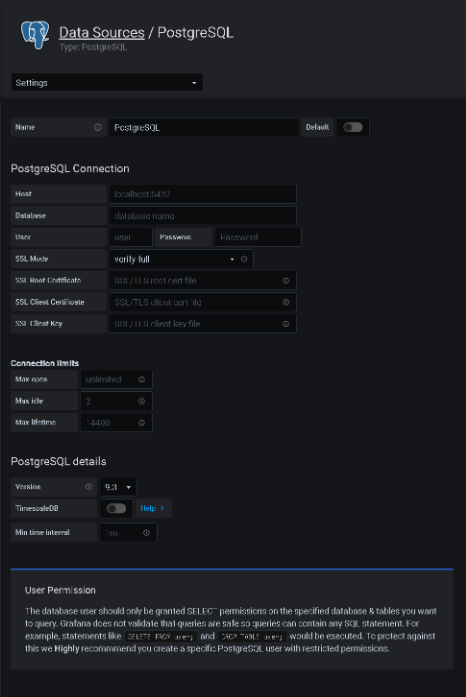
- Fill the data source settings in using the following values:
- Name: step-postgres
- Host: POSTGRES_URL (default localhost: 5432)
- User and Password: Credentials of the account that you wish to use to connect to the DB. We recommend setting up a Grafana specific, read-only user.
- SSL Mode, Connection limits: Configure as required by your needs.
- PostgreSQL details:
- Version: your PostgreSQL version. We recommend at least v12
- TimescaleDB: If you are using TimescaleDB, enable this option to use Timescale specific functions for time-binning and querying for better performance. Consult Step documentation for instructions regarding Timescale and Step data.
- Min time interval: This will set minimal granularity of the time bin on the horizontal axis on all dashboards created using this data source. If you are working with data that changes very rapidly over time and want to have the ability to zoom in deeply, you may want to set it to 1ms, the precision of the timestamps created by Step. Otherwise, 10ms or 100ms should be fine. This setting only affects querying and plotting the data.
Data source name (step-postgres) and database name (step) are required for the dashboards to work. Make sure there are no typos.
Congratulations! You have set up a data source that will communicate with the measurement data stored in PostgreSQL from Step.
Prometheus
- Configure your Prometheus data source similarly to MongoDB and PostgreSQL data sources.
- Look up the port where your Prometheus service resides in the Prometheus configuration (prometheus.yml).
- Name your data source as step-prometheus.
Automatic data sourcing provisioning
Grafana offers you the ability to automatically provision data sources using yaml files instead of configuring them from the UI. Provided below is a starter template for a data source yaml file that you can use and modify according to your needs and exact database configuration in order to provision your Step data sources in Grafana:
# # config file version
apiVersion: 1
datasources:
- name: step-postgres
type: postgres
url: localhost:5432
database: tutorial
user: $STEP_POSTGRES_USER
secureJsonData:
password: $STEP_POSTGRES_PWD
jsonData:
sslmode: "disable"
postgresVersion: 1200
timescaledb: true
- name: step-mongo
type: grafana-mongodb-datasource
url: localhost:3333
jsonData:
mongodb_url: mongodb://localhost:27017
mongodb_db: step
Step performance dashboards
Now that you have configured the data sources, you can import Step performance dashboards. Grafana stores dashboards as json files with all the queries and panel configurations embedded.
There are 2 interconnected dashboards that use Step data:
- Execution list dashboard displays available executions in a given time frame. Clicking on an execution ID within a table redirects you to the Execution overview dashboard. This dashboard contains the execution ID and its selected start and end times.
- Execution overview dashboard displays measurements associated with a particular execution within a given time frame. Clicking on the link in the top right corner redirects you to the Execution list dashboard.
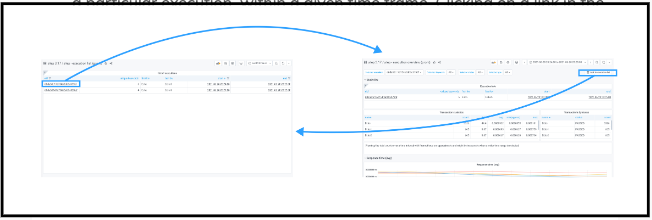
We have prepared one dashboard set per each data source and equivalent data source queries. The only difference between the data sources is the calculation percentiles and some statistical parameters. MongoDB doesn’t provide the built-in percentile accumulator yet. For rapid percentile calculations in PostgreSQL we recommend installing the t-digest extension.
Grafana offers multiple ways to import a dashboard.
Summary: This article demonstrates how to connect Grafana to data generated by Step, via configuring Grafana, importing a performance dashboard, and visualizing Step data in Grafana.
This article demonstrates how to set up distributed system monitoring using Keyword executions, and analyze the results as measurements.
This tutorial demonstrates how to automate interaction with Microsoft Office applications using the Office Interop Assembly.

This article provides documentation for how to integrate JUnit tests into Step.
This tutorial demonstrates how Step can be used to monitor services, availability and performance metrics.
This tutorial demonstrates how to utilize the AutoIt C# binding to automate interactions with Windows applications.
This article demonstrates the automation of mobile applications on Android using the Appium framework.
This article defines three Keywords which will be used in browser-based automation scenarios, using Step and Selenium, as general drivers.

This tutorial shows you how to efficiently set up a browser-based load test using existing Cypress tests in the Step automation platform.
In this short tutorial, we show how to quickly implement a simple browser-based load test based on Cypress scripts in Step.

This tutorial shows you how to efficiently set up a browser-based load test using existing Playwright tests in the Step automation platform.

This article explains Keywords in Step and demonstrates how to create simple ones.

This tutorial demonstrates the design, execution, and analysis of functional tests using the web interface of Step.
This tutorial will demonstrate how to use Step and Selenium to automate various browser tasks.

This tutorial demonstrates how to use Step and Cypress to automate various browser tasks.
This tutorial demonstrates how Selenium automation tests can be turned into full synthetic monitoring using Step.

In this tutorial, we'll show you how to easily set up and run a browser-based load test with Step's wizard, using your existing Cypress tests, on the Step automation platform.

This tutorial shows you how to efficiently set up a browser-based load test using existing Selenium tests in the Step automation platform.
This tutorial demonstrates how Playwright automation tests can be turned into full synthetic monitoring using Step.
This tutorial demonstrates how Cypress automation tests can be turned into full synthetic monitoring using Step.
This tutorial will demonstrate how to use Step and Playwright to automate various browser tasks.

In this tutorial, we'll show you how to easily set up and run a browser-based load test with Step's wizard, using your existing Playwright tests, on the Step automation platform.
Learn how to quickly set up continuous browser-based load testing using Cypress tests in your DevOps pipeline
Quickly integrate K6 based load-tests in your DevOps workflow

This tutorial demonstrates how Playwright tests can be reused for synthetic monitoring of a productive environment in a DevOps workflow

This tutorial demonstrates how Playwright tests can be reused for synthetic monitoring of a productive environment in a DevOps workflow
In this tutorial you'll learn how to quickly set up a protocol-based load test with okhttp

Learn how to set up continuous end-to-end testing across several applications based on Playwright tests in your DevOps pipeline using Step

Learn how to quickly set up continuous browser-based load testing using Playwright tests in your DevOps pipeline
Want to hear our latest updates about automation?
Don't miss out on our regular blog posts - Subscribe now!