Synthetic Monitoring with Selenium
This tutorial demonstrates how Selenium automation tests can be turned into full synthetic monitoring using Step.
Get Step SaaS for free to follow this tutorial
Synthetic monitoring, also known as active monitoring, is a method of monitoring your applications by simulating users, and directing the path they might take through the application. This provides information on the availability and performance of your critical business transactions.
This tutorial will demonstrate how Selenium automation tests can be turned into full-fledged synthetic monitoring in just a few minutes, simply by leveraging the Step platform. At the end of the tutorial, you’ll be able to setup end-to-end synthetic monitoring for a web application (such as our e-shop opencart demo application) by:
- Integrating your selenium test case with Step
- Designing and configuring your synthetic monitoring
- Visualizing the performance and availability dashboard
- Setting up alerts in order to get notified in case of errors
We prepared a small Java project that will be used throughout this tutorial. The project uses Selenium to automate interactions with a (demo) online shop: OpenCart. We host a demo instance specifically to be used for our web automation tutorials.
Because the reusability of your automation artifacts is one of the main advantages of Step, you can directly jump to the definition of the scenario if you already followed our tutorial for selenium load testing
In this tutorial we will use this selenium automation to set up synthetic monitoring on our online shop application.
Requirements
- Step: You can either install Step Enterprise or OS following the quick setup guide or get a SaaS instance up and running in minutes. For most users the SaaS option is recommended, you can get it easily up and running on stepcloud.ch.
- Git
- Maven 2 or higher
- JDK 11 or higher
- (optional) The Chrome browser
- (optional) ChromeDriver, for automating a browser
Hint: The optional software is recommended to follow the local parts of this tutorial. You can skip all steps requiring ChromeDriver and still finish the tutorial if you are only following the SaaS solution.
Preparing the sample project
We have prepared a sample project that will be used throughout this tutorial which uses Playwright to automate interactions with a test environment called OpenCart that is provided by us.
1. Get the code
The project is available on GitHub; to clone it using git, run:
git clone git@github.com:exense/step-tutorials.git
2. Look at the source code
Take a moment to look at the sample project code
- The class SeleniumOpencartTestcaseAsKeyword illustrates how to transform simple selenium automation code into a Step keyword* in no time. To integrate it with Step:
- extend the class AbstractKeyword
- and use the @Keyword annotation on the method containing your selenium test case
- The SeleniumOpencartSingleKeywords class shows how to split the exact same selenium code into individual keywords*, each representing one user interaction.
- requires slightly more modification of your automation code but enables to:
- reuse the same automation code to simulate multiple user paths with Step
- get automatic performance measurements for individual user interactions**
- Finally, for both classes, Junit tests are provided to execute and validate your keywords locally.
*Definition: In Step, keywords are the primary building blocks implementing your automation. Using the keyword API, you can transform any automation code into a keyword seamlessly.
**Note: With the first approach, performance measurements will be created automatically for the entire test case only, but you can use the keyword api to add custom measurements in your code.
3. (optional) Run tests locally, requires ChromeDriver
To see the interactions that are performed, run the JUnit tests:
cd step-tutorials/step-selenium-tutorials
# If ChromeDriver is installed system-wide and added to the path:
mvn clean compile test
# Otherwise, explicitly specify the ChromeDriver path:
mvn clean compile test -Dwebdriver.chrome.driver=c:/tools/chromedriver/chromedriver.exe
The test cases will automate a browser to add a product to the cart and perform a checkout.
4. Package the code
Finally, we will create a Java package (jar file) that can be used to ship the automation code as keywords to Step. To do so, run:
mvn clean package -DskipTests
This command creates a jar file named step-selenium-tutorials-0.0.0.jar in the target folder of the project directory. This is the file that we will use in the subsequent steps.
Switch to your Step instance
If you have access to an existing Step instance (on-premise or cloud), access it and log in, see prerequisites if not. Remember that for on-premise setup Chrome and Chromedriver must be available on the Step’s agents.
1. Import the keyword package
Step has a special view for managing Keywords. This screenshot shows the Keywords view with the Upload Package dialog open as a reference for the next steps.
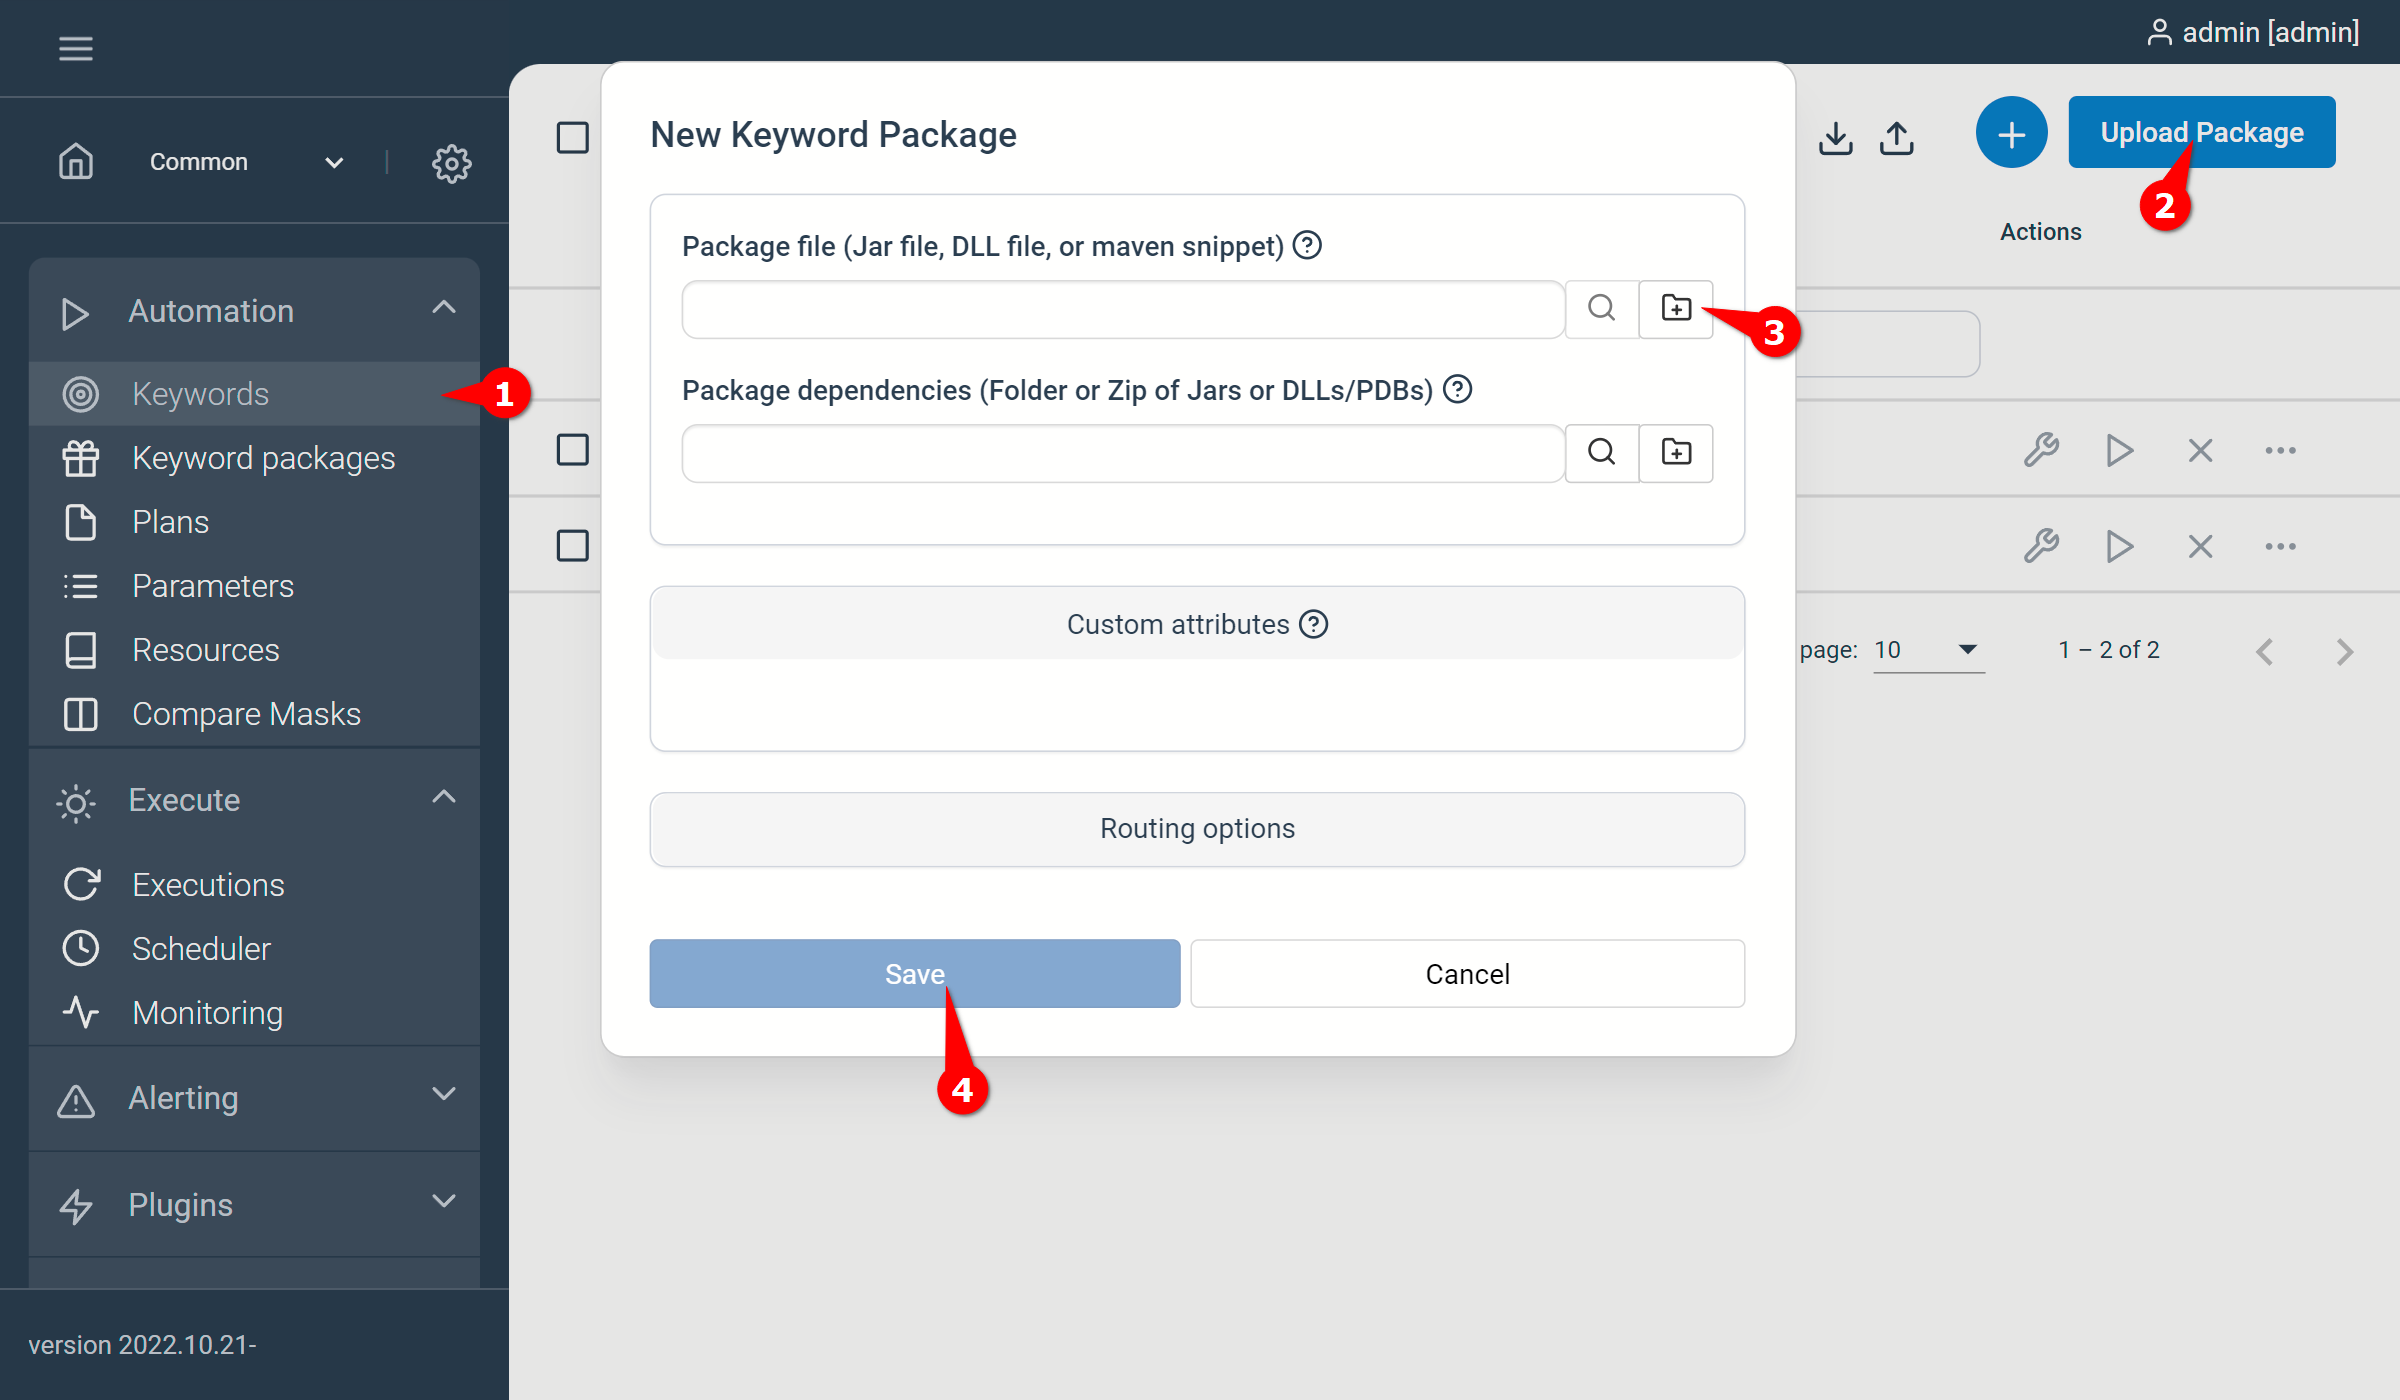
- Navigate to Keywords
- Click the Upload Package button
- Select the demo-opencart-selenium-0.0.0.jar as the package file
Hint: Make sure you selected the correct file. If successful you will see two keywords listed. - Click Save to do the import
2. Define the TestCase
Now that all the basics are established, we can setup a TestCase to define the monitored feature. This is done in Step with plans.
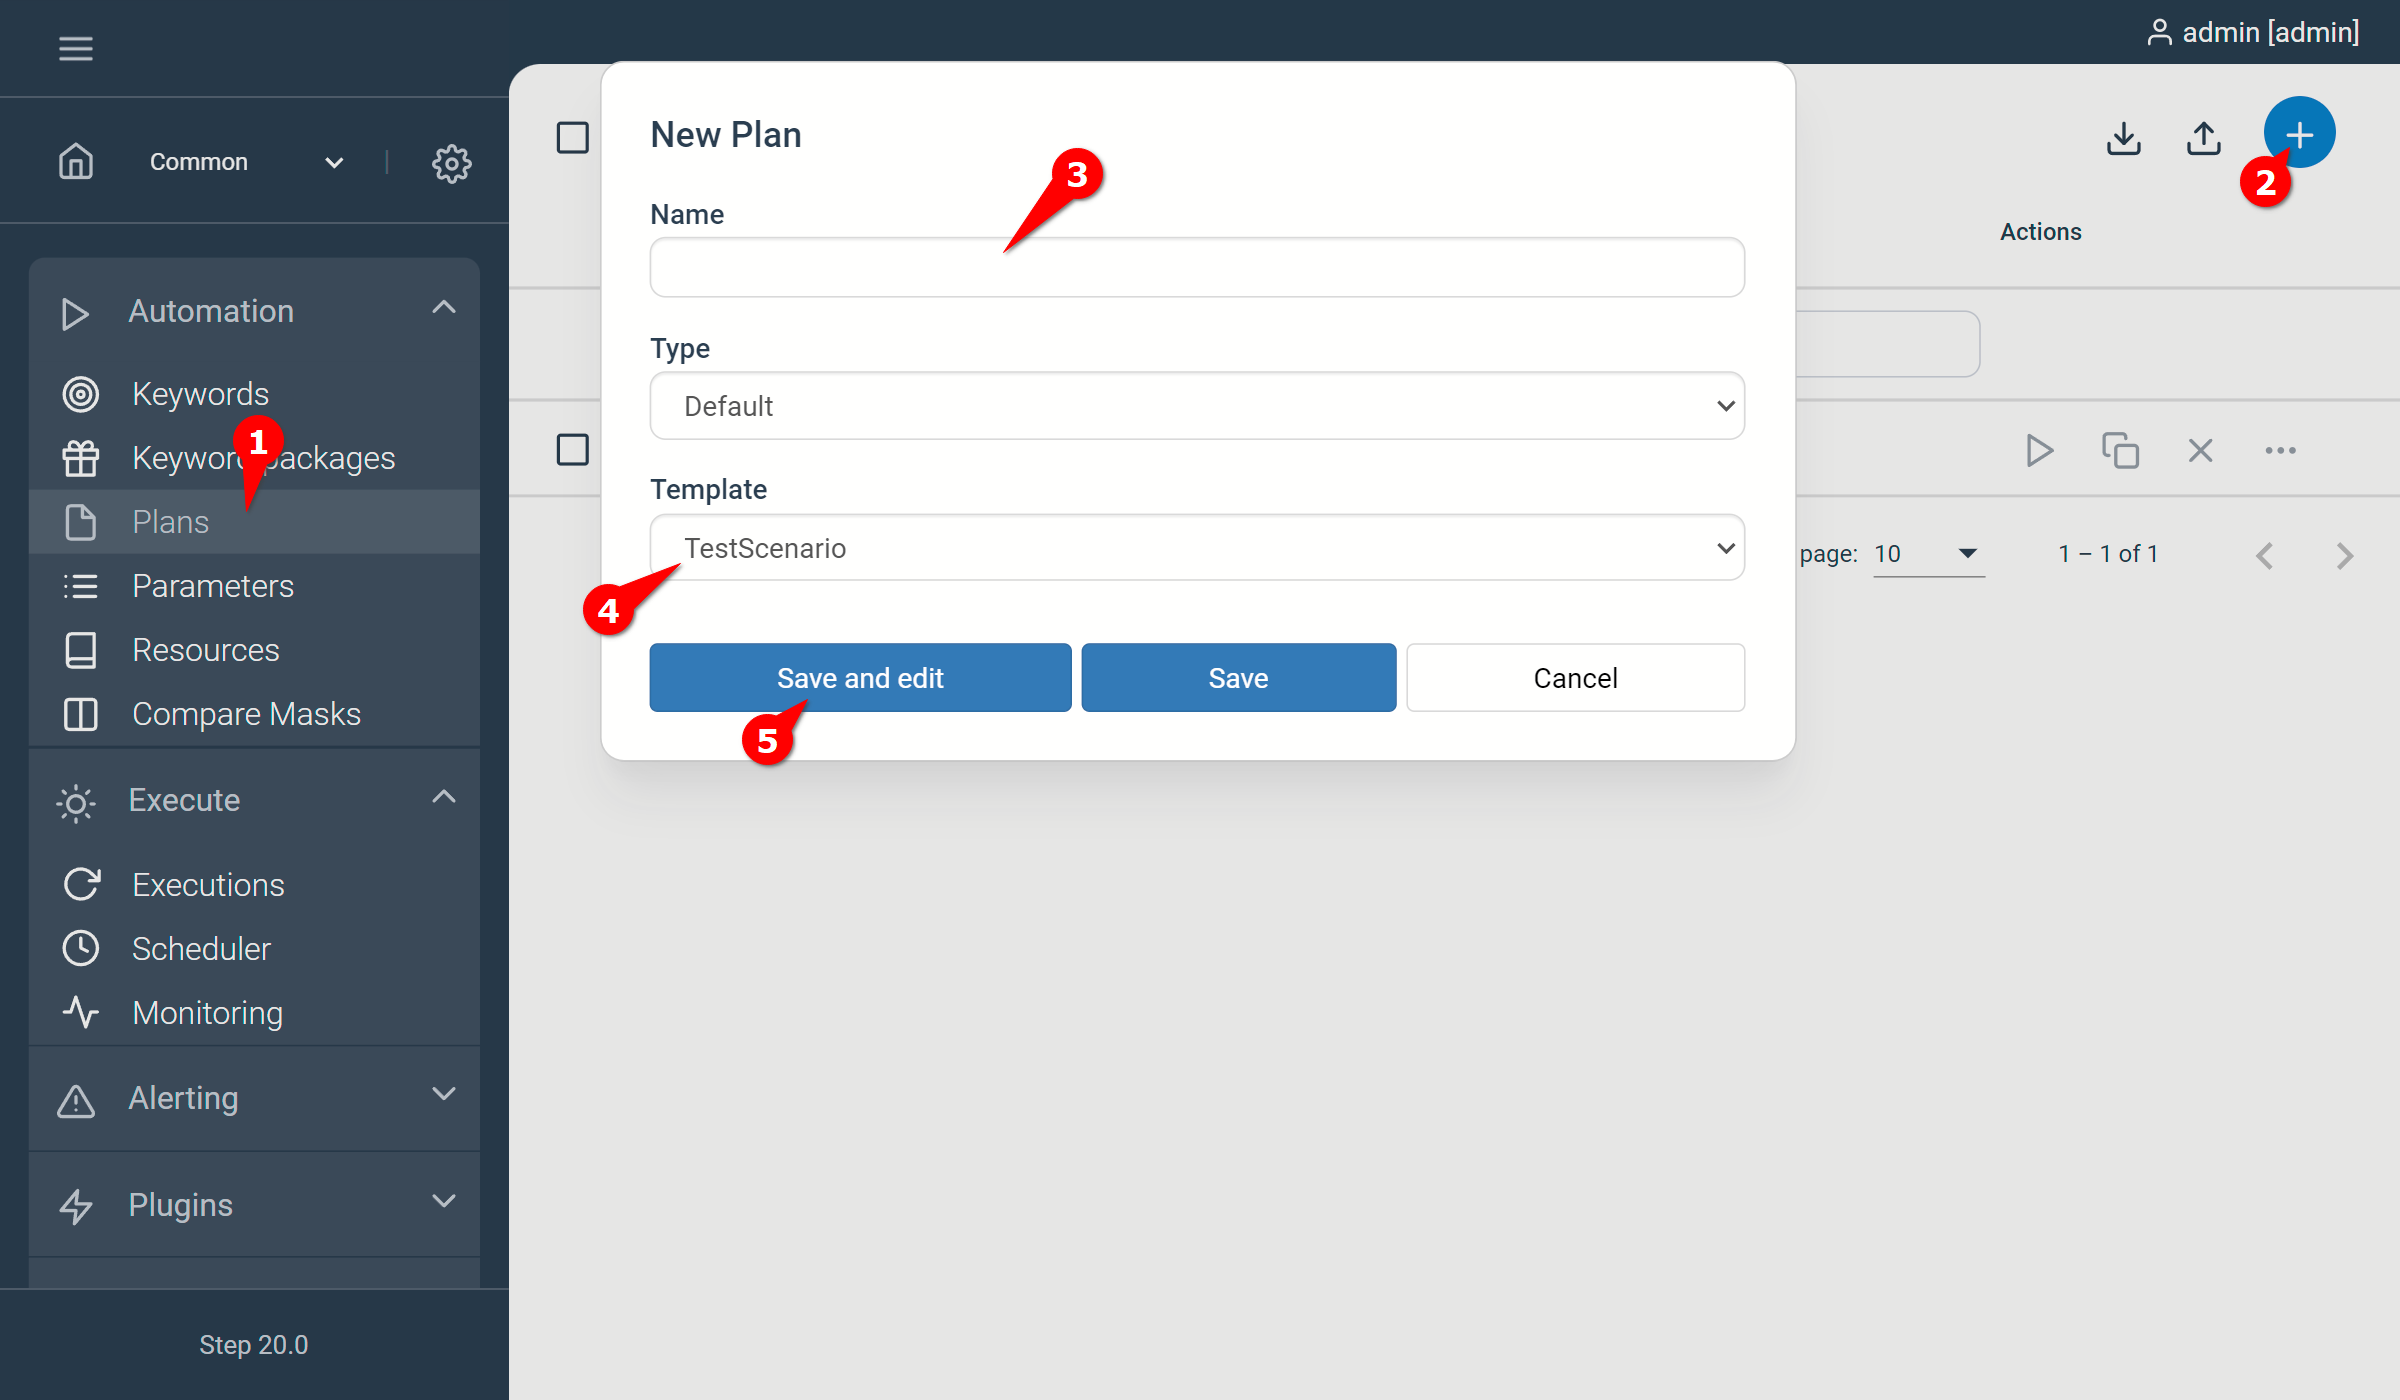
- Navigate to Plans
- Click + to create a new plan
- Enter a name
- Select “TestCase” as a Template
- Click Save and edit
3. Configure the plan
The visual plan editor is the main tool in to create and edit plans in Step. We will use this to create the TestCase, so get familiar with the UI explained in this screenshot:
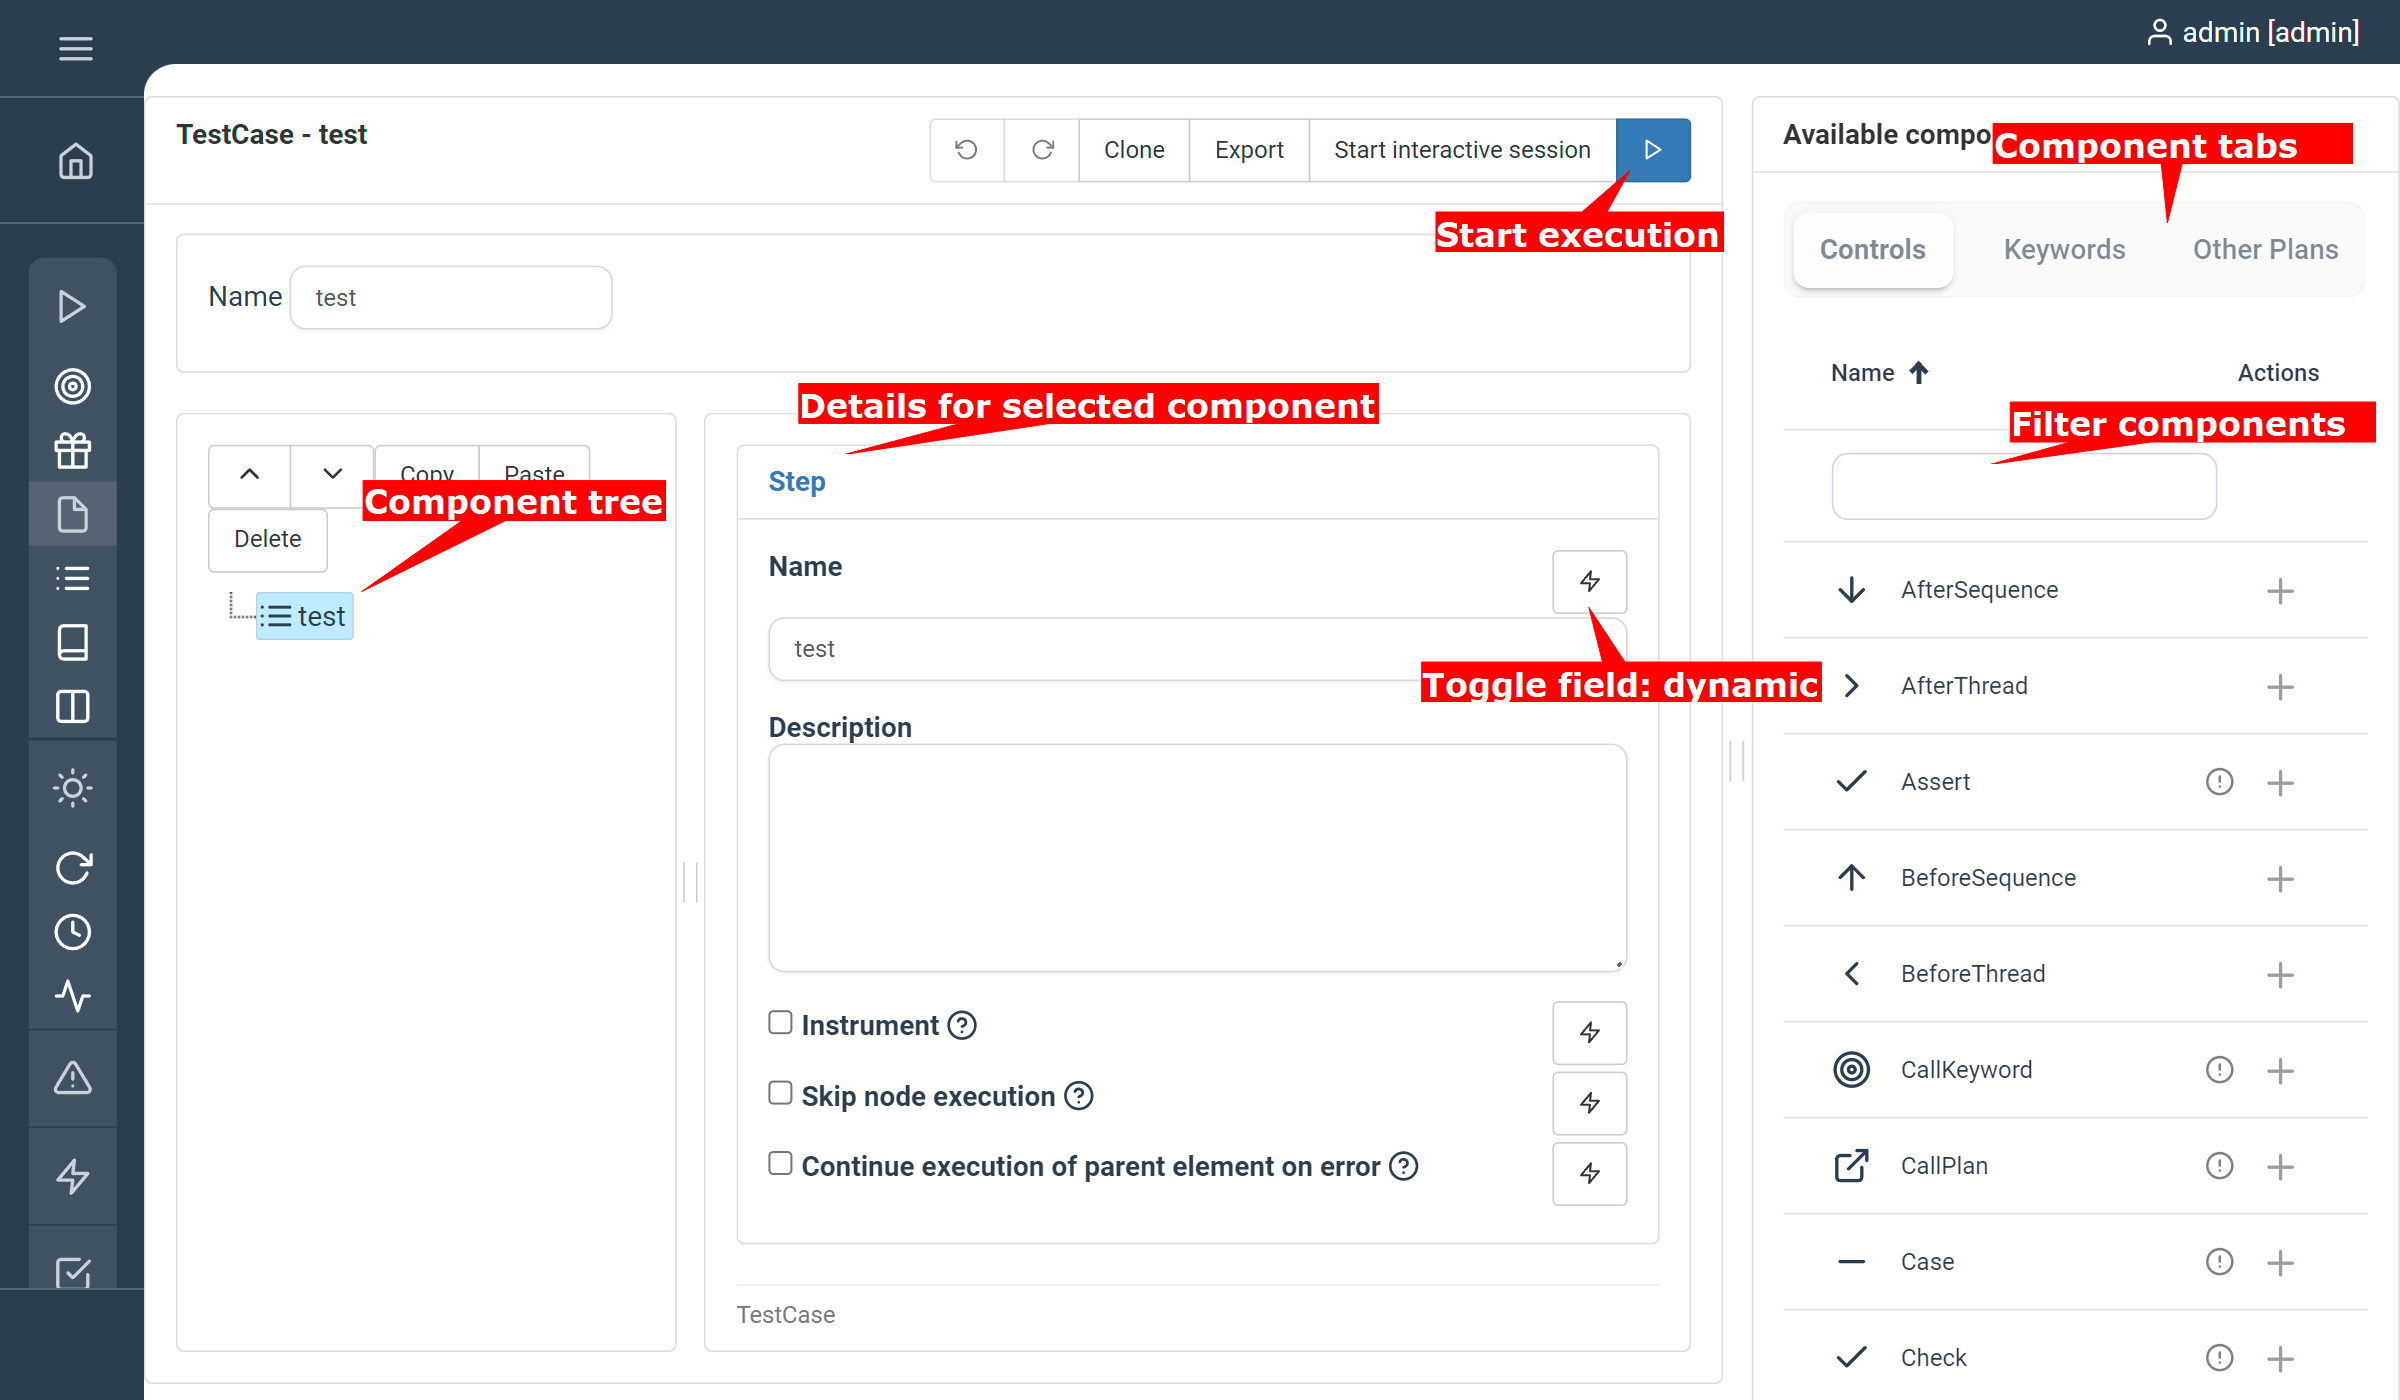
We will familiarize ourselves with the Step visual editor by adding the keyword: “Opencart Testcase as Keyword” and executing it once.
- Select “Keywords” in the Component tabs
- Select the keyword “Opencart Testcase as Keyword” in the list shown Hint: Filter the components to easily find your keywords.
- Click Start execution and confirm with the play button in the dialog
Synthetic monitoring
Step contains a powerful scheduler module that allows us to execute plans periodically.
1. Setup the synthetic monitoring
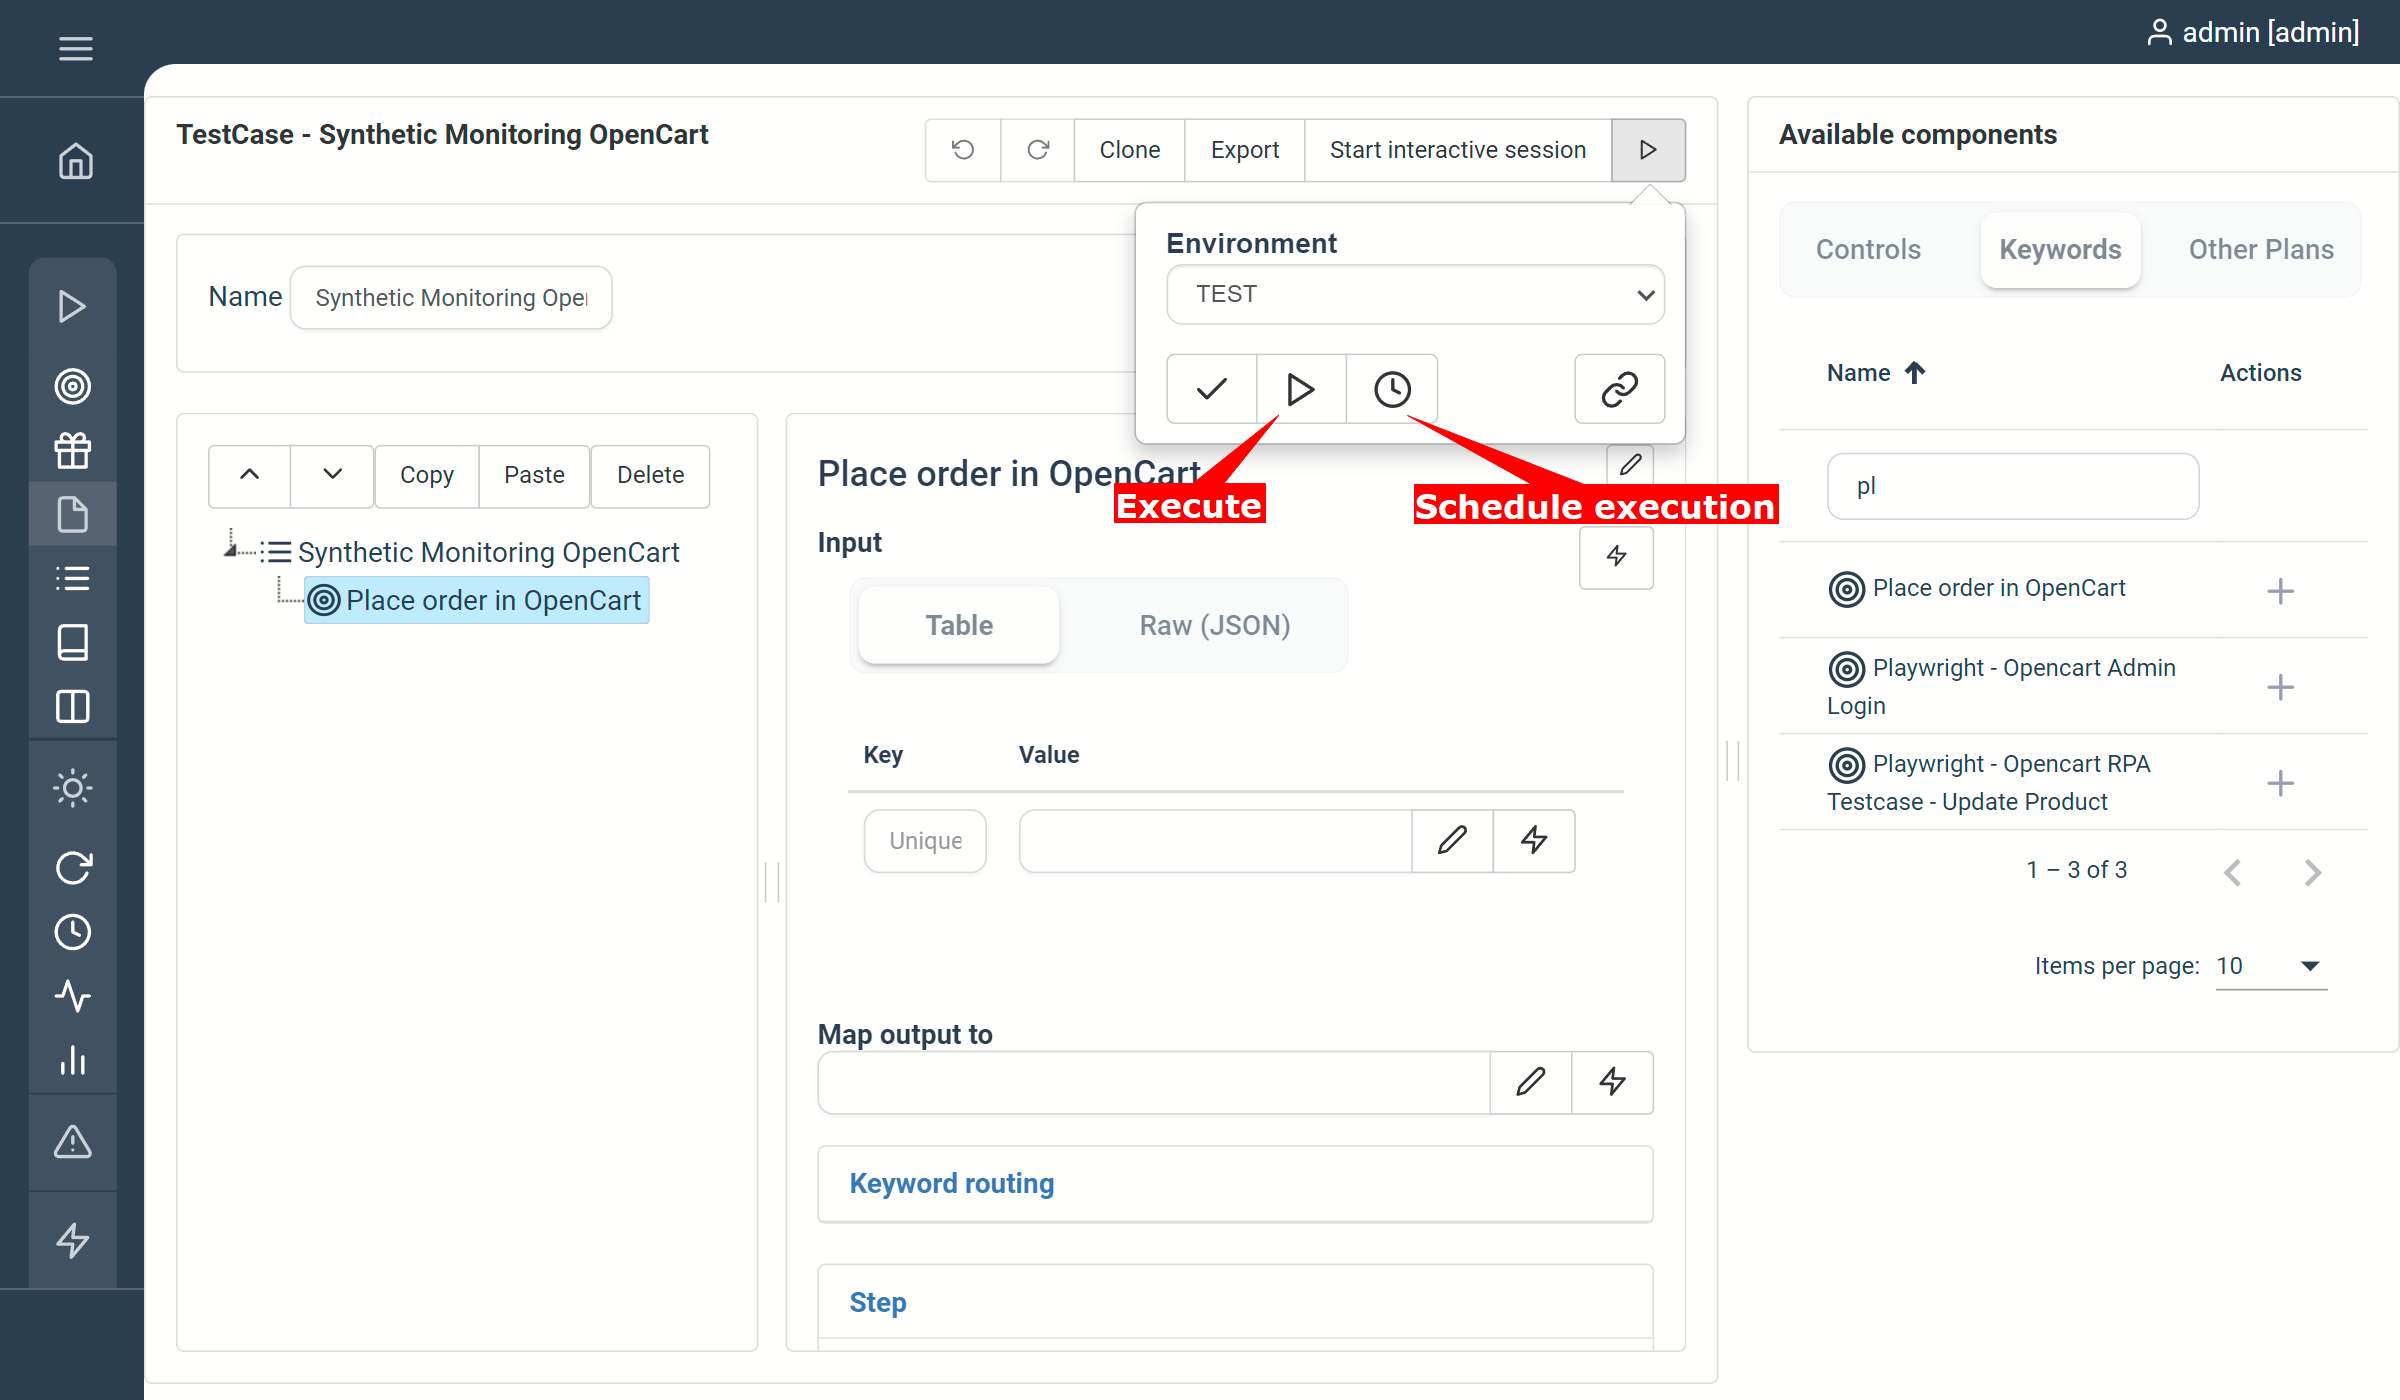
To actually perform the synthetic monitoring, we will use the scheduling feature of Step. Simply click the “run” button and schedule the executions with your choice of frequency:
Now that the synthetic monitoring is in place, you will see in the next sections how to monitor the performance and availability of your system, as well as how to create notifications in order to be automatically alerted in case of error.
2. Monitor your scheduled executions
On the Monitoring view you can follow the latest status of your scheduled tasks. You can do this by clicking on the last execution to see the related execution reports, or by clicking on the chart icon to jump to the performance dashboard.
3. Analyze monitoring
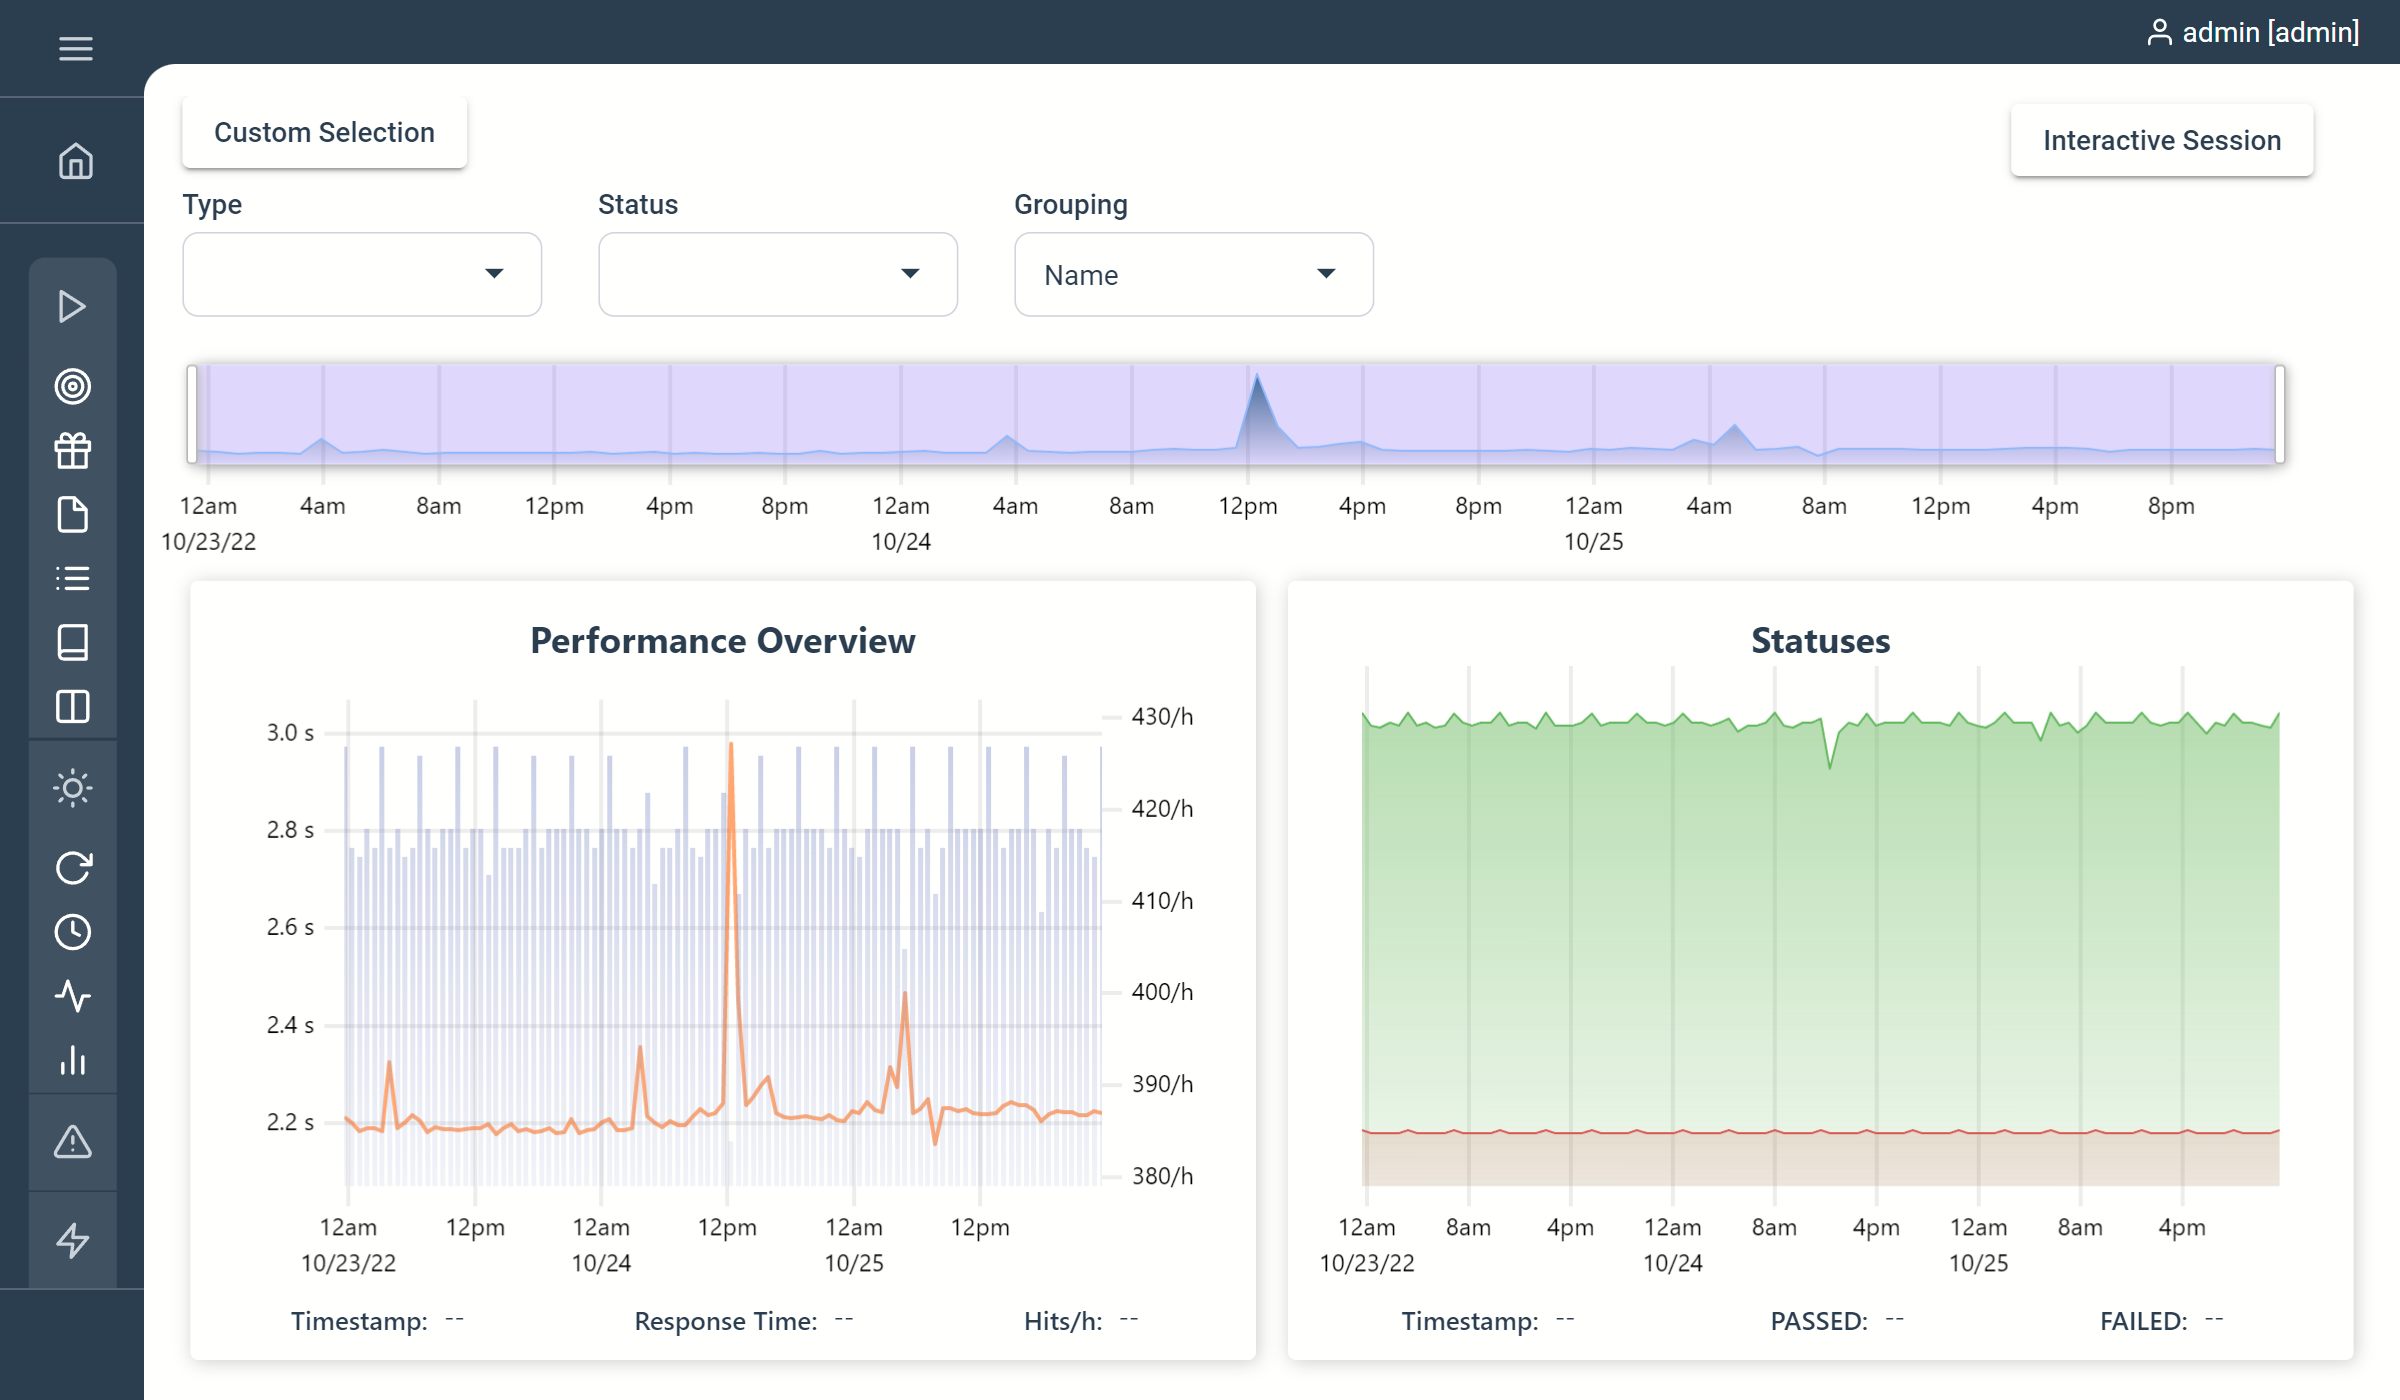
On the performance dashboard, you can easily follow the overall performance and success rate of your synthetic monitoring, as well as the detailed statistics for individual user interaction with the monitored system.
4. Notifications for the monitoring
Pre-requisite: You will need to configure your notification gateway (email or webhooks).
While you can actively check the status and performance using the monitoring and dashboard views, for synthetic monitoring it is always recommended to be automatically alerted in case of errors. Setting up alerts for a given plan can be done directly from an execution or from the Notification Subscription menu entry.
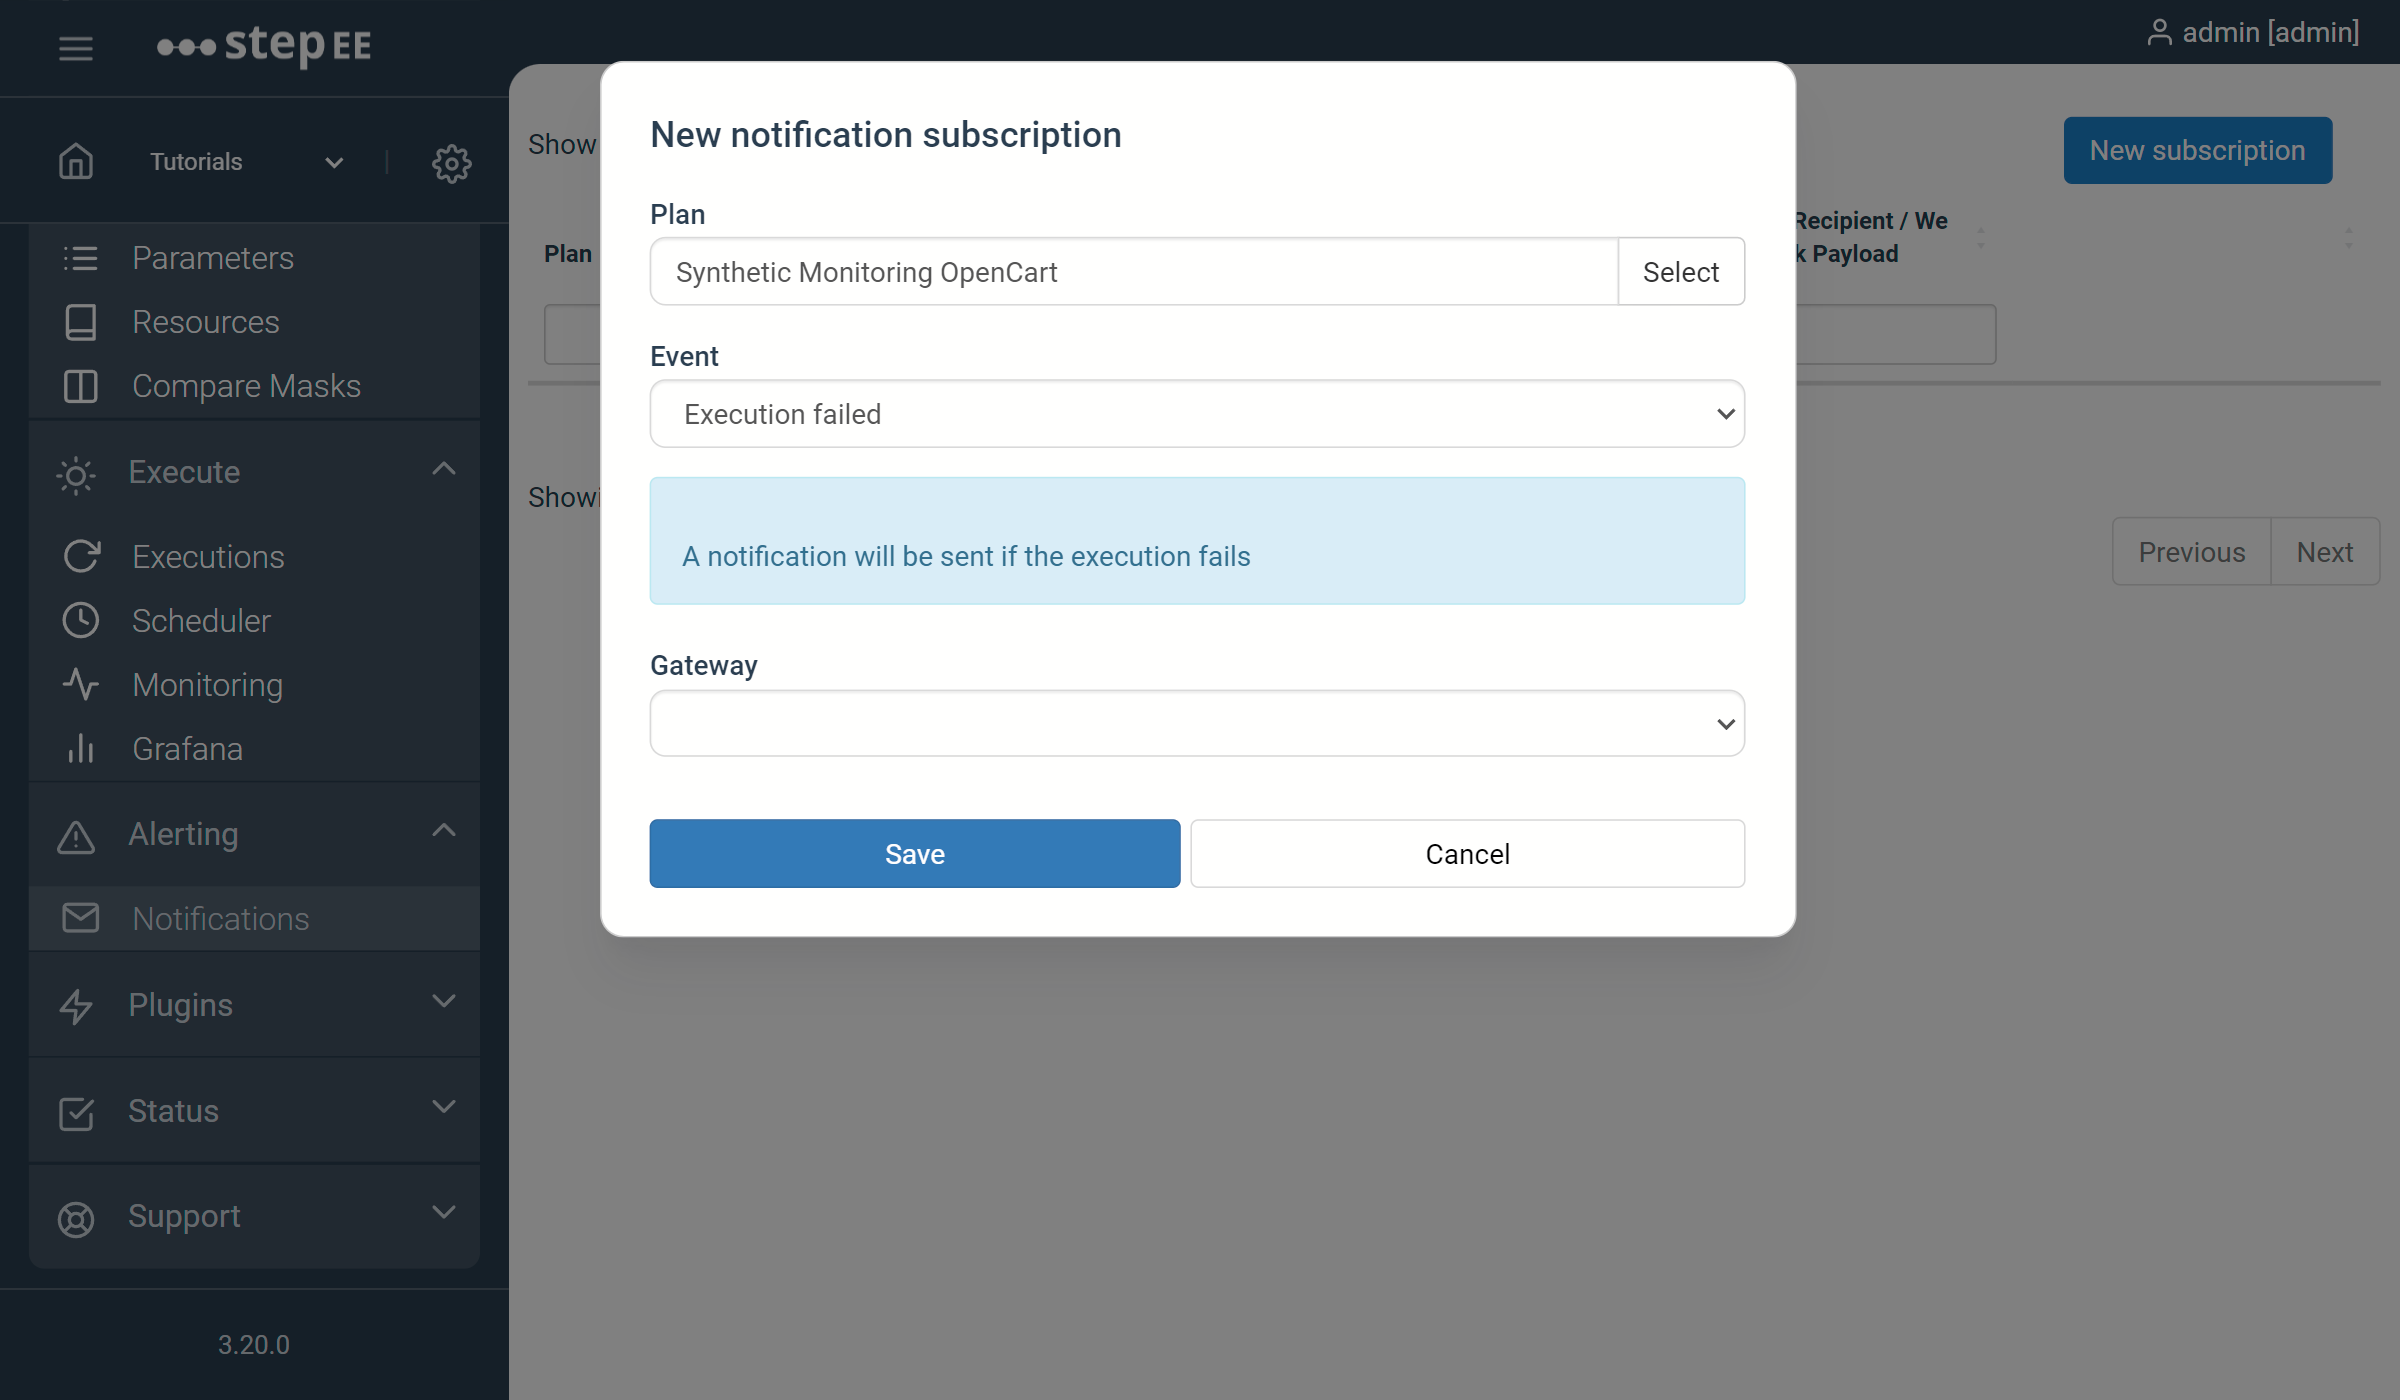
Select Alerting → Notifications in the menu and create a new subscription. Select the plan you want to receive notifications about, the event that should trigger them and a Gateway where they should be delivered on.
Monitor and analyze the results
On the Monitoring view, you can follow the latest status of your scheduled tasks:
- click on the last execution to see the related execution reports
- click on the chart icon to jump to the performance dashboard
1. Analyze the results
On the performance dashboard, you can easily follow the overall performance and success rate of your synthetic monitoring, as well as find detailed statistics for individual user interaction within the monitored system.

2. Setup alerts with notification subscriptions
Prerequisite: If not already configured, you will need to configure your notification gateway (email or webhooks)
While you can actively check the status and performance using the monitoring and dashboard views, during synthetic monitoring it is always recommended to be automatically alerted in case of errors. Setting up alerts for a given plan can be done directly from an execution, or from the Notification Subscription menu entry.
Here we create an alert for our plan for failing executions:
Detect slow response times
To realize the full potential of synthetic monitoring, nonfunctional assertion should be added to the plan in order to detect response times above SLA. You can easily do that by adding performance assertions to your plan.
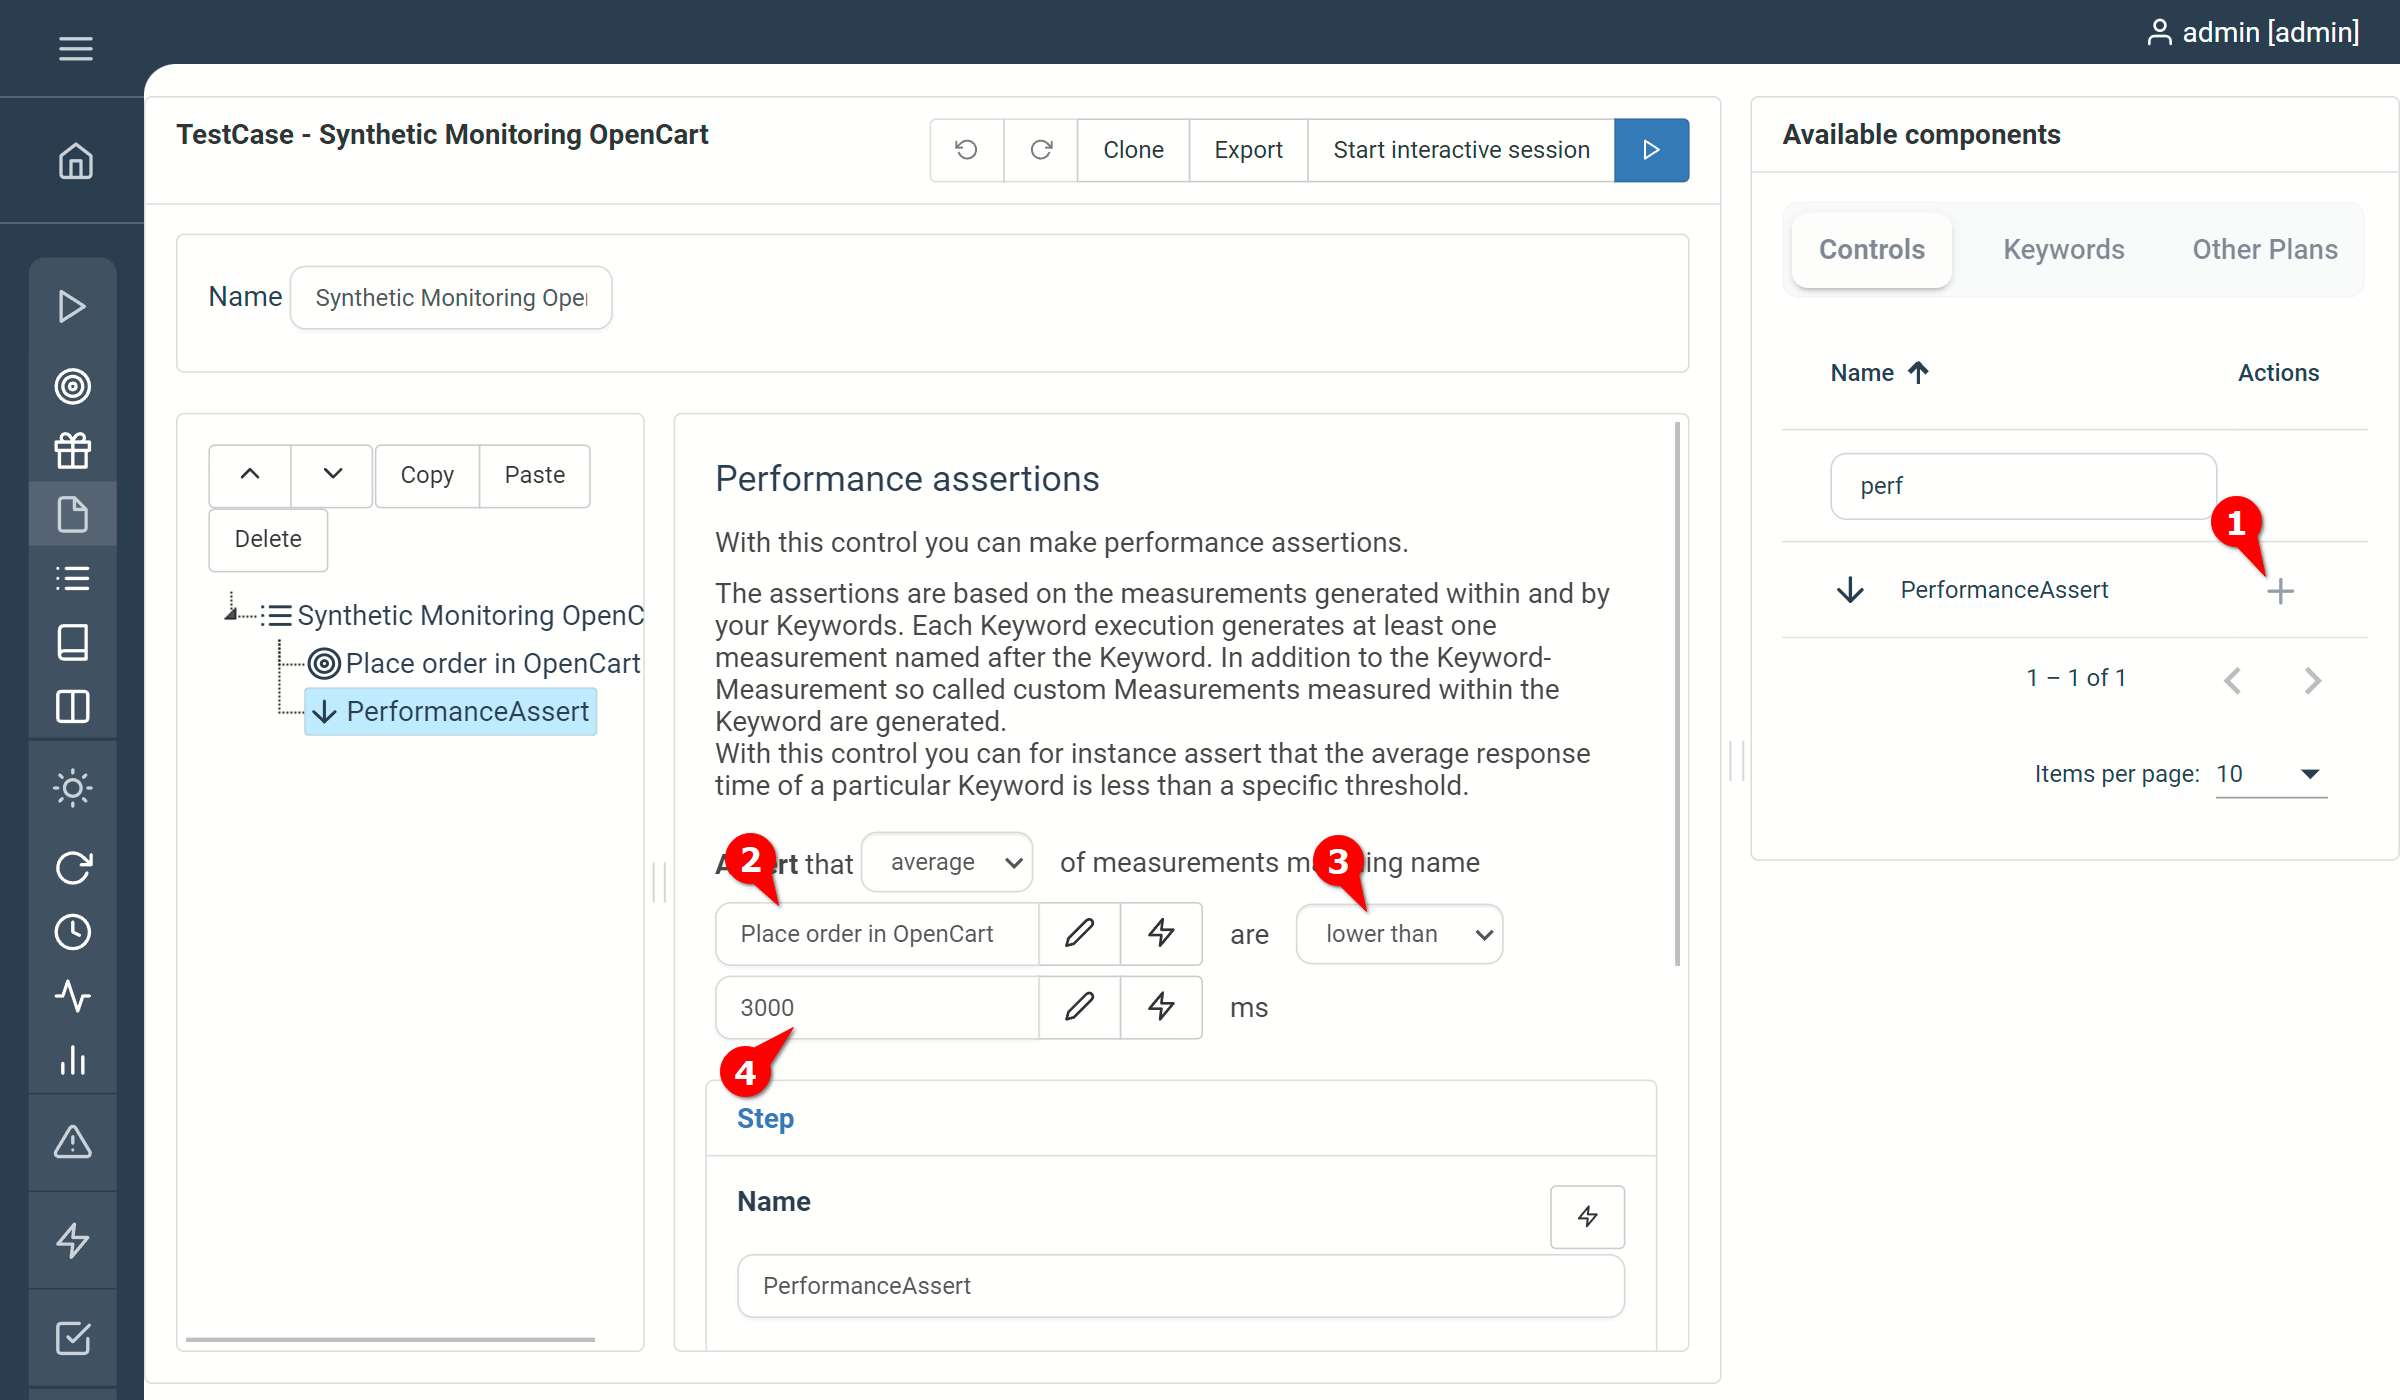
- add PerformanceAssert from the Controls tab
- type the exact name of the keyword that should be measured
- specify “lower than” (default)
- select the SLA (3000 is default)
This article demonstrates how to connect Grafana to data generated by Step.
This article demonstrates how to set up distributed system monitoring using Keyword executions, and analyze the results as measurements.
This tutorial demonstrates how to automate interaction with Microsoft Office applications using the Office Interop Assembly.

This article provides documentation for how to integrate JUnit tests into Step.
This tutorial demonstrates how Step can be used to monitor services, availability and performance metrics.
This tutorial demonstrates how to utilize the AutoIt C# binding to automate interactions with Windows applications.
This article demonstrates the automation of mobile applications on Android using the Appium framework.
This article defines three Keywords which will be used in browser-based automation scenarios, using Step and Selenium, as general drivers.

This tutorial shows you how to efficiently set up a browser-based load test using existing Cypress tests in the Step automation platform.
In this short tutorial, we show how to quickly implement a simple browser-based load test based on Cypress scripts in Step.

This tutorial shows you how to efficiently set up a browser-based load test using existing Playwright tests in the Step automation platform.

This article explains Keywords in Step and demonstrates how to create simple ones.

This tutorial demonstrates the design, execution, and analysis of functional tests using the web interface of Step.
This tutorial will demonstrate how to use Step and Selenium to automate various browser tasks.
This tutorial demonstrates how to use Step and Cypress to automate various browser tasks.

In this tutorial, we'll show you how to easily set up and run a browser-based load test with Step's wizard, using your existing Cypress tests, on the Step automation platform.

This tutorial shows you how to efficiently set up a browser-based load test using existing Selenium tests in the Step automation platform.
This tutorial demonstrates how Playwright automation tests can be turned into full synthetic monitoring using Step.
This tutorial demonstrates how Cypress automation tests can be turned into full synthetic monitoring using Step.

This tutorial will demonstrate how to use Step and Playwright to automate various browser tasks.

In this tutorial, we'll show you how to easily set up and run a browser-based load test with Step's wizard, using your existing Playwright tests, on the Step automation platform.
Learn how to quickly set up continuous browser-based load testing using Cypress tests in your DevOps pipeline
Quickly integrate K6 based load-tests in your DevOps workflow

This tutorial demonstrates how Playwright tests can be reused for synthetic monitoring of a productive environment in a DevOps workflow

This tutorial demonstrates how Playwright tests can be reused for synthetic monitoring of a productive environment in a DevOps workflow
In this tutorial you'll learn how to quickly set up a protocol-based load test with okhttp

Learn how to set up continuous end-to-end testing across several applications based on Playwright tests in your DevOps pipeline using Step

Learn how to quickly set up continuous browser-based load testing using Playwright tests in your DevOps pipeline
Want to hear our latest updates about automation?
Don't miss out on our regular blog posts - Subscribe now!